Typhoons

National Weather Service Forecast Office in Guam and the University of Guam Water and Environmental Research Institute Typhoon Mangkhut Wind Assessment for Rota, CNMI

Background

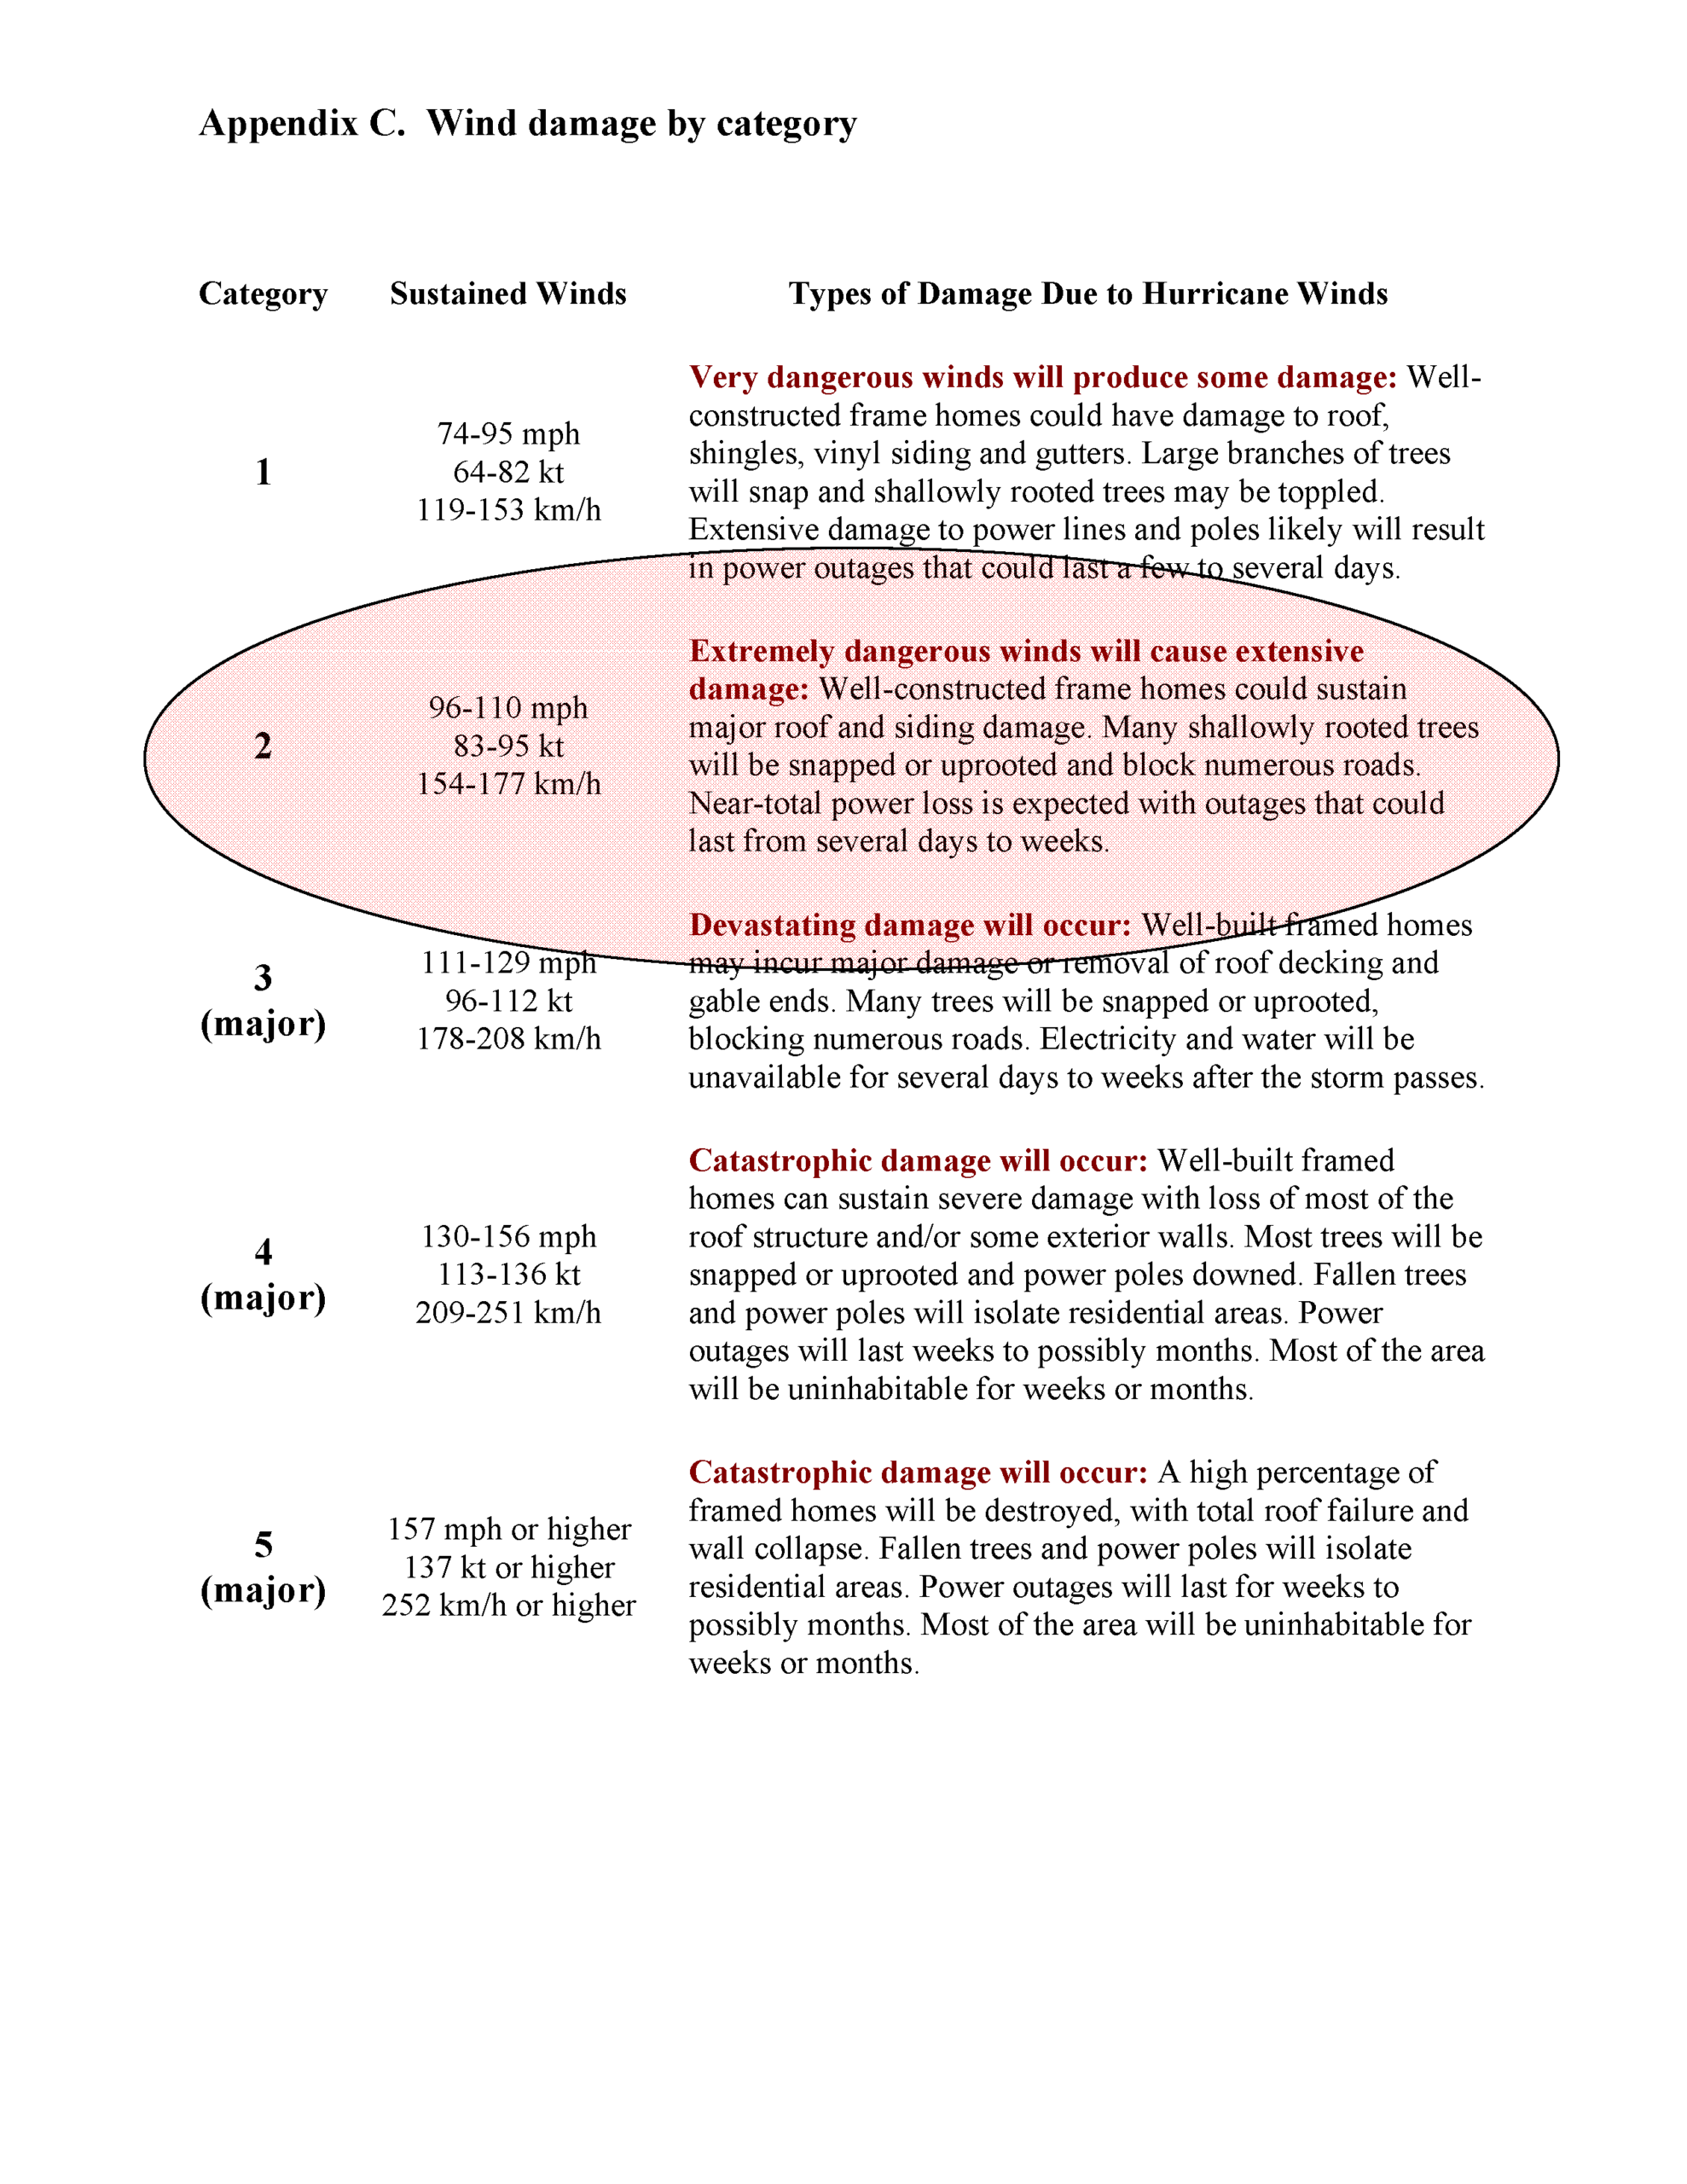
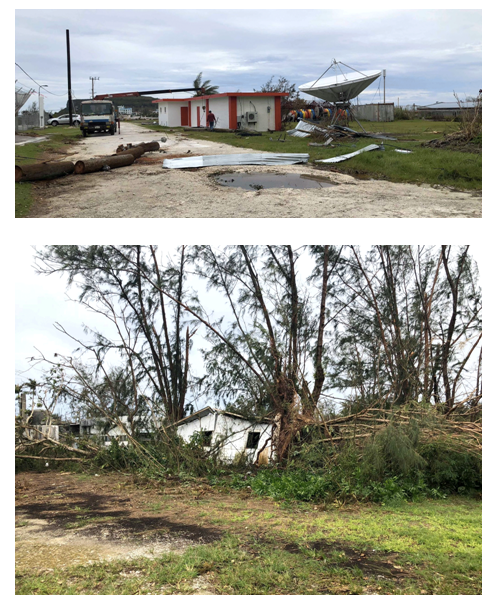
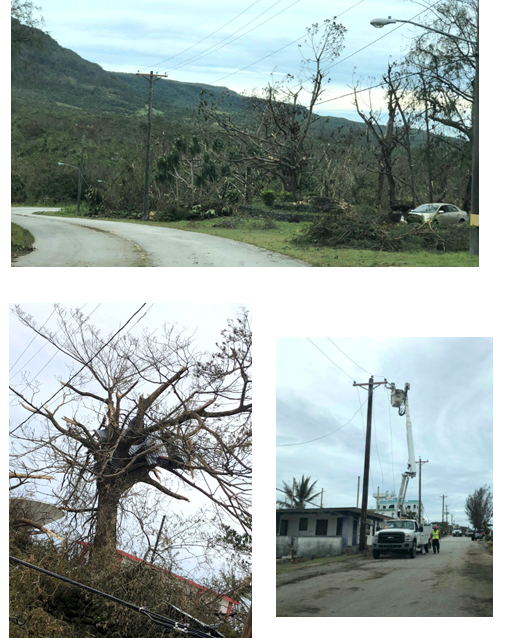
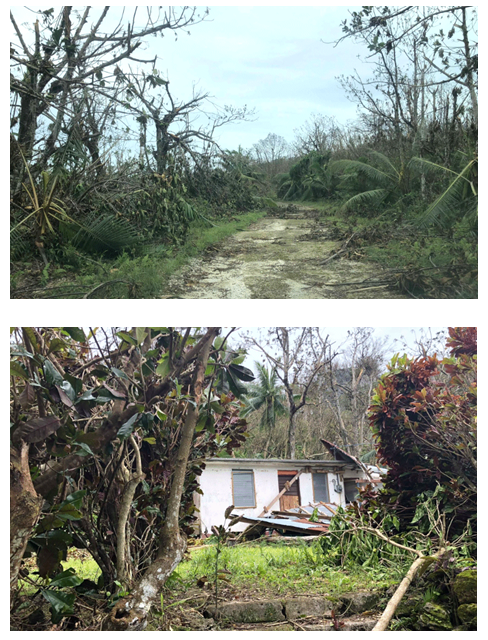
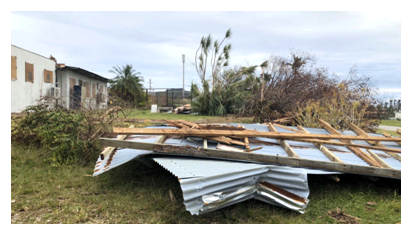
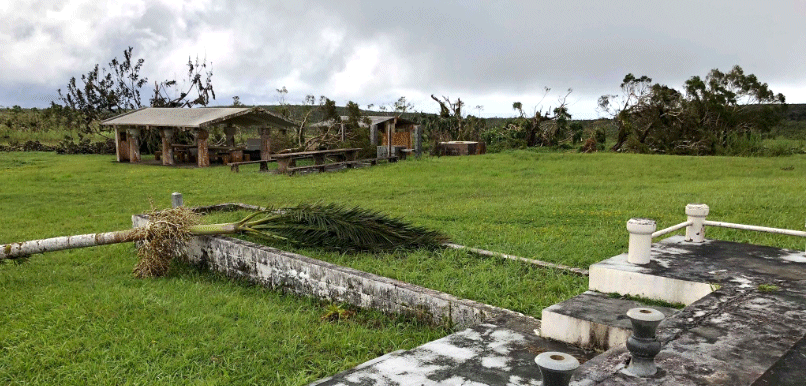
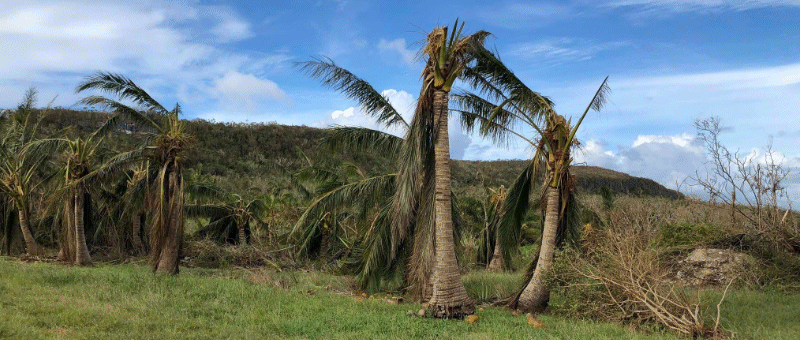
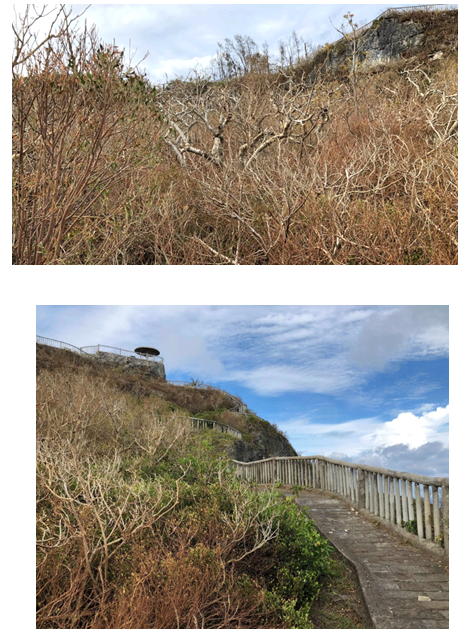
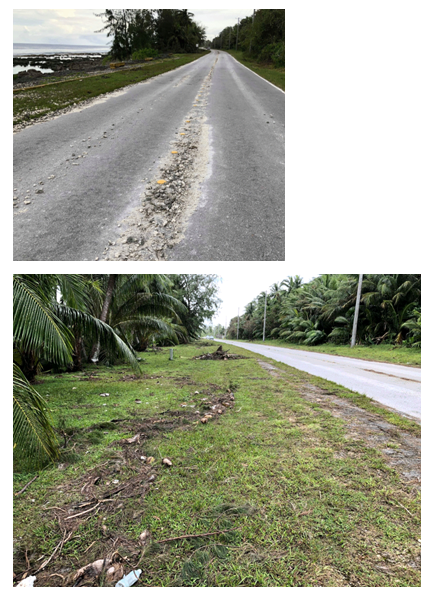
During the late afternoon of September 10, 2018, Typhoon Mangkhut passed directly over the island of Rota. Though described as major by local Homeland Security officials, the level of damage to vegetation and older wooden homes made of plywood and weathered corrugated metal roofing was notably below the devastating or catastrophic effects of a major (i.e., CAT 3 or higher) hurricane/typhoon. Measured rainfall at the Rota International Airport (4.84 inches) was also relatively light for the direct eye passage of a typhoon. Damage to infrastructure was moderate, with only a few wooden power poles blown down, and isolated incidences of electrical and phone wires stripped away and lying in the roadways.

Rota Island has not had a devastating strike by a typhoon since the eye of Typhoon Chaba passed nearby on the night of August 22, 2004. Residents of Rota Island (who experienced both typhoons) generally indicated that Chaba was a stronger typhoon there than Mangkhut. The following quote is clipped from the Wikipedia entry for Typhoon Chaba:

“Rota was positioned beneath Chaba’s eyewall for several hours, resulting in extremely heavy rain and strong winds. The highest recorded wind gust there peaked at 219 km/h (136 mph), and gusts in excess of 160 km/h (100 mph) were documented for ten consecutive hours. Total rainfall measurements at Rota International Airport reached 528 mm (20.80 in). Extensive damage resulted on Rota, with the complete destruction of 50 homes. An additional 175 homes sustained minor damage. The toppling of electrical infrastructure resulted in island-wide power outages. … Overall, 13 people were injured and damage costs totaled to approximately US$18 million in the Northern Mariana Islands.”

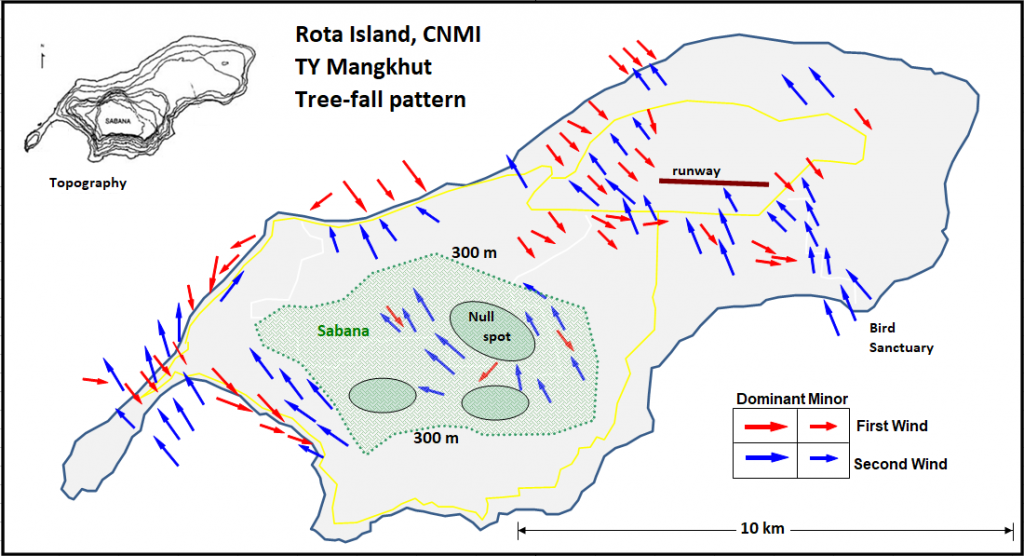
Typhoon Mangkhut had an asymmetric structure when it hit Rota, with the most intense convection (as per satellite and radar imagery) on the eastern side of the storm. This asymmetry, along with gradual intensification as it passed westward over the island resulted in the effects of the second-wind (i.e., the SSE wind during the passage of the eastern eyewall) being generally more pronounced and slightly more severe than the effects of the first-wind (i.e. the NNW wind on the western side of the typhoon).

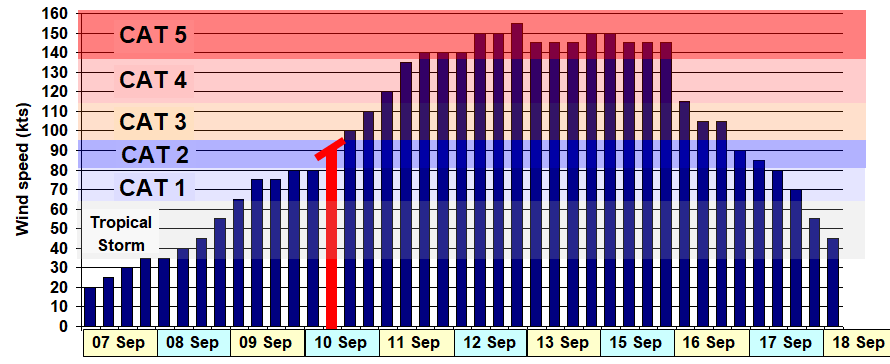
The landfall intensity of Mangkhut (as assessed herein) was relatively close to the expected intensity for at least 48 hours prior to its landfall. Thus, most residents were well prepared for the direct hit, and were not surprised by any of the effects of the storm. Also, there was a general satisfaction with the weather forecasts and warnings.

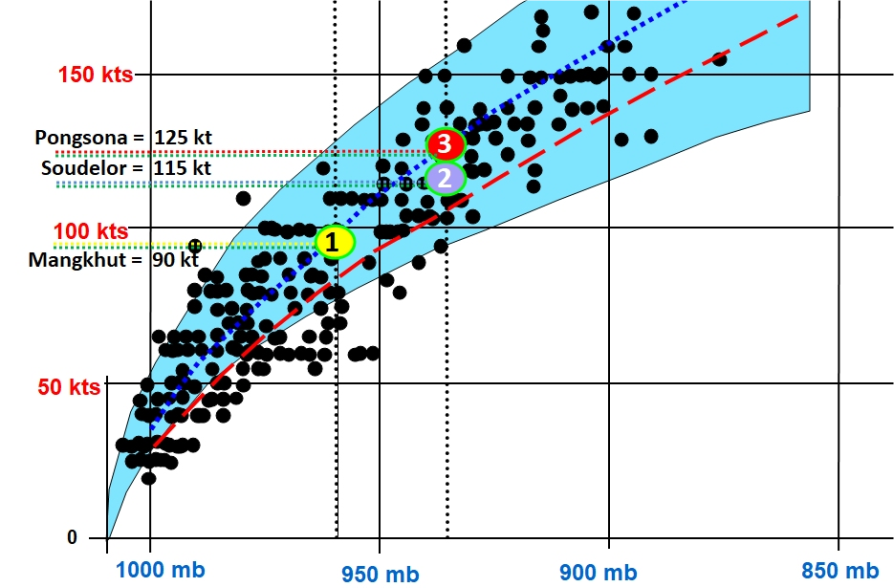
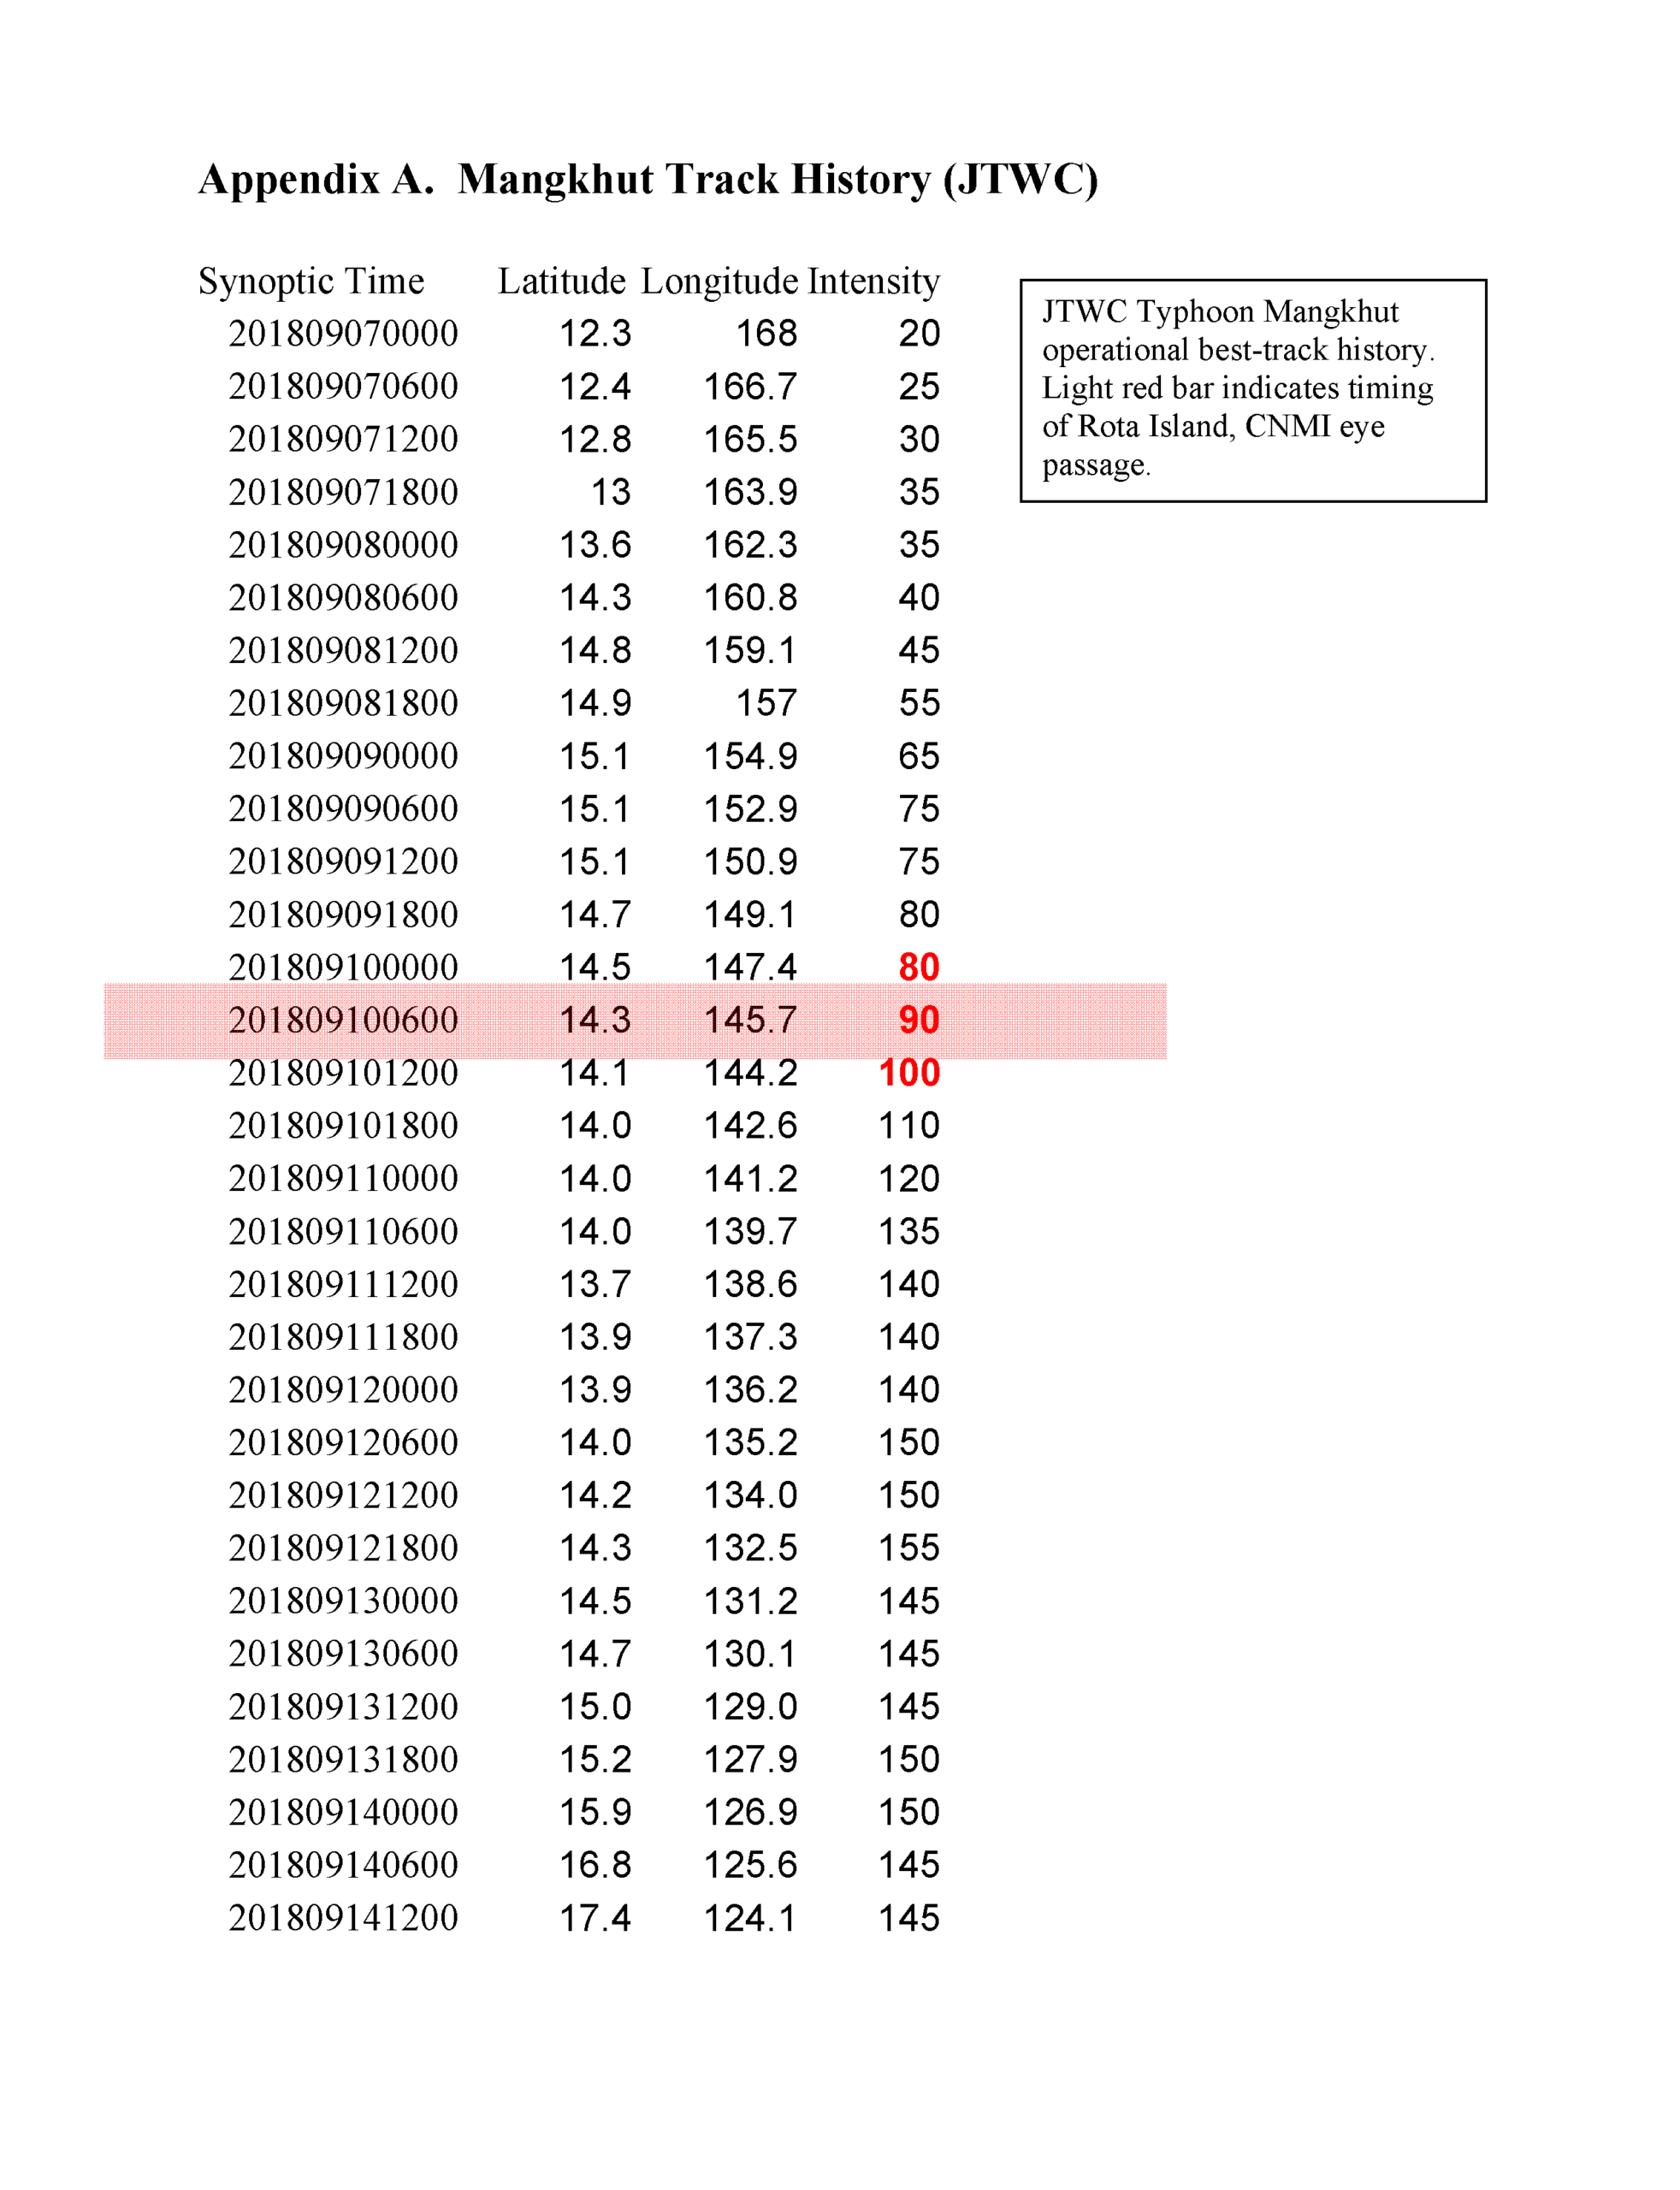
About the time of Mangkhut’s passage, the NWS instruments and the WSR-88D failed; thus there was no ground truth on the maximum winds that occurred, although a pressure reading of 960 mb within the eye was captured by on-site instrumentation at the Rota International Airport (RIA). With no ground-truth wind measurements and consideration of reports of major damage from CNMI Homeland Security, the Meteorologist in Charge of the National Weather Service, (NWS) Weather Forecast Office Guam (WFO Guam), requested that a team of two WFO forecasters and a University of Guam typhoon scientist travel to Rota to determine the landfall intensity of Mangkhut on Rota Island, CNMI. Working around limited flights to the island, the loss of base-load power generation, and the general post-typhoon chaos, the meteorological assessment team members William Brandon Aydlett1, Marcus Landon Aydlett1, and Dr. Mark A. Lander2 arrived on Rota three days after the typhoon event to conduct a thorough damage assessment. What is contained herein is the team’s meteorological assessment of Typhoon Mangkhut on Rota Island, including a determination of the landfall intensity.

1 WFO Guam. 2 University of Guam.

Storm Statistics

Track

Typhoon Mangkhut formed well to the east of the Mariana Islands. Beginning as a disturbance that passed through the northern atolls of the Republic of the Marshall Islands (e.g., Kwajalein), it followed a long, rapid westward track, with damaging winds reaching the Mariana Islands in only three days. After passing the CNMI, Mangkhut continued on to northern Luzon in the Republic of the Philippines and then to southern China (Figure 1 and Appendix A). As indicated by most numerical guidance several days in advance, Typhoon Mangkhut underwent a period of unusual southwestward motion that took it from the latitude of Saipan to its passage over Rota (Figure 2).

Typhoons - Fig 1
Figure 1. The track of Typhoon Mangkhut. Red color track indicates the typhoon stage.
Typhoons - Fig 2
Figure 2. A zoom of a portion of the track of Typhoon Mangkhut. The latitude scale has been stretched to emphasize the unusual southwestward motion during the typhoon’s passage over Rota. The plotted positions are JTWC preliminary working best-track locations.

Eye Passage Over Rota Island

The eye of Typhoon Mangkhut made a direct passage over Rota (see the NEXRAD image in Figure 3). The GFS model-derived streamlines in Figure 4 show the wind pattern as the eye approached Rota. The south-southeast winds on the east side of the typhoon were likely stronger on Rota than the north-northwest winds on the west side of the typhoon, in part because of the asymmetry of the convection, and in part because of the gradual intensification of the typhoon as it was passing over and to the west of the island. Eyewitnesses on the island generally reported about an hour of relative calm in the eye, with a rapid increase of wind during the entry into the eastern eyewall.

Measured Wind, Rain and Minimum Pressure

The anemometer at the RIA survived the first-wind of the typhoon, but was blown off the tower early in the ramp-up of the second-wind. Storm total rainfall measured at the RIA was 4.84 inches in the manually-read brass rain can. Readings from a collocated Fischer-Porter type rain gauge may be available at a later date. Both of the rain gauges have a poor exposure to rainfall accompanied with a north and northwest wind—the case with the approaching Mangkhut. Minimum sea level pressure in the eye of Mangkhut was measured to be 960 mb at the RIA. The loss of anemometer data during the most intense portion of the storm supported the need for the MET assessment.

Typhoons - Fig 3
Figure 3. The NEXRAD composite reflectivity image at 5:05 PM local time shows the eye of Mangkhut directly over Rota Island. Note the asymmetry of convection: (1) heavier on the south side and weaker on the north side; and (2) a thicker more intense eyewall south-through-east. Keep in mind that the radar cuts through the typhoon at-or-above about 4,000 feet at the distance of Rota Island from the radar site on Guam, thus the northern half of Mangkhut is affected by a slightly higher beam elevation and by attenuation.
Typhoons - Fig 4
Figure 4. Streamlines of the low-level wind field at 4:00 PM local time based on GFS model output. Streamlines are courtesy of the NULLSCHOOL website, with arrows for wind direction, and with the island locations added.

Rota Island Meteorological Assessment (MET) Team Findings

Wind Assessment

(1) Measured Wind. The vane-with-propeller-type anemometer (see inset to the right) at the Rota International Airport was blown from its tower mount during the rapid increase of wind in the second half of the typhoon. The MET Team was allowed onto the airfield to see the tower with its missing wind instrument. The instrument itself landed about 20 feet from the tower, and was retrieved by airport personnel after the storm. It now sits on a desk in the Federal Aviation Administration’s Aeronautical Information System Replacement (AISR) supplemental weather observer 3rd floor office. 

(2) Wind Assessment by Other Means. The Rota MET Team used three other sources of information to obtain proxy estimates of the peak winds during Mangkhut’s passage over Rota Island: (1) the minimum sea level pressure measured in the eye; (2) available weather radar and meteorological satellite data; and, (3) the level of damage to structures, infrastructure and vegetation. By meshing observations and theory, it is possible to progressively whittle down the likely maximum winds to a narrow range, and to propose a single value as the most likely maximum 1-minute average, 10-meter height wind speed as the typhoon traversed Rota Island. 

The techniques used to evaluate the wind speeds from observed levels of damage are outlined in Guard and Lander (1999). Techniques of Fujita (1971, 1992) were used to assess possible anomalous hurricane transients and tornadoes, and to determine first wind and second wind contributions. Because of the differing gust factors over land and water, the maximum sustained wind provided for Mangkhut is the over-water equivalent (OWE) value. The gust associated with any 1-minute sustained OWE value is set using a gust factor of 1.22. This is the standard used in the warnings of the Joint Typhoon Warning Center and closely resembles that derived by Krayer and Marshall (1992) for gust factors applied to hurricane winds. The assessed peak wind determined by the MET Team is intended to represent the OWE 1-minute average at a 10-meter/32.8-foot elevation. Knots are converted to miles-per-hour (mph) using the factor: wmph=1.15 wkts, and to meters per second (mps) using the factor: Wkts =0.5144 Wmps.

(3) Pressure. The NWS SUTRON remote observation system located at the RIA recorded a minimum sea level pressure of 960 mb during the calm period within the eye. This reading was telemetered to WFO Guam in near-real time (Edson, personal communication). To estimate a possible peak wind from this pressure reading, various wind-pressure relationships (WPR) (e.g., Atkinson and Holliday (1975), Kraft (1961), Callaghan and Smith (1998)) were considered. There is no single WPR that exactly fits all tropical cyclones, and there is a relatively large spread (+ or – 20 kt) of possible wind speeds for any given central minimum sea level pressure (MSLP). Typhoon structural characteristics are one of the primary reasons for this spread. A sharply peaked radial profile combined with a rapid drop-off of wind outside the radius of maximum wind (RMW) yields the highest peak winds for a given MSLP, while a round-shouldered profile of the peak wind combined with a slow drop-off of wind beyond the RMW yields the lowest wind for a given MSLP. At the time of eye passage over Rota, Typhoon Mangkhut was of average size, with an average-sized eye (~30 km/18.6 miles). Thus, one might expect to find its intensity value on Figure 5 roughly in the middle of the possible range for its MSLP. The WPR analysis was not intended to stand alone as a determinate of the maximum intensity, but was used to ascertain whether or not the 90-kt intensity suggested by other means (as discussed below) was a reasonable wind speed for a typhoon with an MSLP of 960 mb. Indeed, from Figure 5, this is the case.

Typhoons - Fig 5
Figure 5. Wind-pressure relationships for Western North Pacific TCs. For Mangkhut’s 960 mb MSLP over Rota (the “1” within the yellow circle), a maximum sustained wind speed ranging from 80 kt to about 110 kt is within reasonable bounds. The higher wind speeds for a given pressure are often associated with smaller TCs with sharp highly peaked wind profiles. The 90 kt intensity for Mangkhut arrived at by other means is entirely consistent with Mangkhut’s measured MSLP. The red dashed line is the Atkinson and Holiday WPR used for many decades by the JTWC. The blue dashed line runs through the middle of all western North Pacific reconnaissance wind reports and also lies in the middle of the theoretical bounds for sharp and broad wind profiles indicated by the blue shading. Two other recent typhoons are included: (2) Soudelor on Saipan (August 2015) and (3) Pongsona on Guam (December 2002).

(4) Position, Structure and Intensity Using NEXRAD Weather Radar. Figure 3 shows the composite reflectivity from the Andersen Air Force Base WSR-88D Doppler Weather Radar (NEXRAD) when the eye of Typhoon Mangkhut was located directly over Rota Island. Shortly after that time, the radar went out-of-service as very heavy rainfall and high winds were affecting Guam. Note that the northern half of the typhoon appears to be weaker than its south side (with an incomplete eyewall on the north side), and that the eastern portion of the eyewall appears to be more convectively vigorous than the western side. This is consistent with the damage survey indication of stronger winds in the second half of the typhoon. The NEXRAD base-velocity product indicated peak outbound winds of 117 kt in the eastern eyewall when the typhoon was over Rota (Edson, personal communication). At the distance of Rota Island from the NEXRAD site on Guam, the peak observed NEXRAD winds in this product would be located at an altitude of about 4000 ft (~1200 m). Experience has shown that the NEXRAD peak wind measurements in the lower 6000 ft of tropical cyclone rainbands and in the eyewall (and also within monsoon squalls) tend to be representative of the highest gusts that might be experienced at local ground observing stations. Thus the peak NEXRAD wind of 117 kts can be used to place an upper bound on the peak gusts on Rota Island at 117 kt.

(5) Wind Estimates Using Satellite Data. Appendix B shows a sequence of infrared satellite pictures at hourly intervals as Mangkhut approached, tracked over, and departed Rota Island. The Dvorak IR enhancement has been applied to the imagery to highlight the coldest cloud tops used to estimate the TC intensity. In all images during the several hours of the typhoon’s approach and passage over Rota Island, the Dvorak techniques yielded a T 5.0 (90 kt) intensity estimate via the “embedded center cloud pattern”. The JTWC arrived at the same satellite estimate of T 5.0 (90 kt) at the time of Mangkhut’s passage over Rota. Later, as the typhoon departed to the west of Rota Island, cloud tops cooled, and the T number rose to T 5.5 (102 kt). Thus, a plot of the JTWC 6-hourly intensities (Appendix A and Figure 6) provide a nice depiction of the gradual increase in intensity during its approach, landfall and exit from Rota Island. The slanted “T” across the red bar in Figure 6 is used to depict this intensification. The typhoon likely stayed within the bounds of Category 2 prior to increasing to Category 3 a few hours after moving to the west of the island.

Typhoons - Fig 6
Figure 6. Time series of JTWC Mangkhut’s intensity. Time of eye passage over Rota Island, CNMI indicated by the red bar. Hurricane/Typhoon categories based on wind speed are shown by the horizontal half-tone color bars. The slanted “T” at the top of the red bar illustrates that the typhoon was intensifying as it approached, passed over, and exited Rota Island. The typhoon likely stayed within the bounds of Category 2 prior to increasing to Category 3 a few hours after moving to the west of the island. Indicated day of September is based on UTC. Add 10 hours for Rota local time.
Typhoons - Fig 7
Figure 7. Typhoon Mangkhut tree-fall pattern on Rota Island, CNMI. Red arrows are the first wind, and blue arrows are the second wind. There was extensive tree fall and wind damage from both the 1st and 2nd winds of the typhoon, but the 2nd wind (blue) was overall more dominant. There was extensive tree fall across the whole island, and areas with no arrows are indicative of the MET team not driving to these areas because of poor road conditions or lack of time. One distinctive feature of the damage to vegetation was the presence of null spots on large portions of the high plateau of the Sabana, where topographic effects prevented high winds in some areas, while other areas were heavily damaged.

(6) Damage Assessment. A damage assessment of structures, infrastructure, and vegetation was conducted over most areas of the island. Several observations stand out. Patches and swaths of heavier wind damage are readily explained by turbulent wind flow across complex terrain. The level of damage in the regions of heaviest damage to structures and vegetation were similar across the island. Ridgelines exposed to the wind appeared to have the most damage to vegetation, with the scrub forest of tangantangan trees almost completely defoliated with remaining leaves brown and dying in areas where salt spray likely contributed to the browning. Across the large flat high-ground of the Sabana, there were large “null” areas where there was very little wind damage noted. However, there were some pockets of heavy damage on the Sabana. The treefall pattern (Figure 7) was confined to falls caused by wind from two primary directions: NNW and SSE, the “First Wind” and “Second Wind”, respectively. The “Second Wind” was dominant at most locations, but not by too wide a margin. A dominant “Second Wind” is consistent with the observed structure of the typhoon (see Figure 3), and the gradual intensification that was taking place during the passage. Photos of damage are shown in plates at the end of the document.

Special indicator levels of damage to vegetation and structures as used in the Saffir-Simpson Tropical Cyclone Scale (STiCS) (Guard and Lander 1999) TC wind damage scale were indicative of high-end Category 2 winds (Appendix C):

(1) Only a few power poles were blown down;
(2) The MET team did not observe any decrowned coconut trees;
(3) Very few (perhaps 1%) of coconut trees were blown down;
(4) only a few instances of downed powerlines were observed;
(5) no large ironwood trees were toppled by snapping at (or near) the base;
(6) only a few large ironwood trees were toppled with a complete uprooting and full exposure of the typical large-diameter shallow root mass;
(7) the heaviest tree damage was to breadfruit trees, which are susceptible to heavy damage even by Category 1 winds;
(8) Forest damage (what MET team member Dr. Lander refers to as “Jungle Crush”) was extensive to Tangantangan trees that were substantially stripped of leaves and blown flat or at low angles to the ground, and to Pago trees, that while not stripped of leaves, were heavily crushed flat to the ground or bent to low angles within the jungle and onto roadways.
(9) structural damage was limited to weaker and/or older plywood and tin-roofed homes;
(10) Reinforced concrete frame buildings, reinforced concrete block walls, and well-designed and constructed metal structures were able to sustain the winds.
(11) Power was out across most of the island at post-typhoon day-3, but cellular telephone service was available at most places.

References

Atkinson, G. D., and C. R. Holliday, 1977: Tropical cyclone minimum sea-level pressure and maximum sustained wind relationship for the western North Pacific. Mon. Wea. Rev., 105, 421-427.
Callaghan, J., and R. K. Smith, 1998: The relationship between maximum surface wind speeds and central pressure in tropical cyclones. Australia Meteorological, Mag., 47, 192-202.
Dvorak, V. F., 1975: Tropical cyclone intensity analysis and forecasting from satellite imagery. Mon. Wea. Rev., 103, 420-430.
Dvorak, V. F., 1984: Tropical cyclone intensity analysis using satellite data. NOAA Tech. Rep. NESDIS 11, 46 pp.
Fujita, T. T., 1971: Proposed characterization of tornadoes and hurricanes by area and intensity. Satellite and Mesometeorology Research Project Research Paper 91, University of Chicago, 42 pp.
Fujita, T. T., 1992: The Fujita tornado scale, In “Mystery of Severe Storms”, p. 31. Wind Research Laboratory Paper 239, Department of Geophysical Sciences, the University of Chicago, 298 pp.
Guard, C. P., and M. A. Lander, 1999: A Scale Relating Tropical Cyclone Wind Speed to Potential Damage for the Tropical Pacific Ocean Region: A User’s Manual, WERI Technical Report 86 (2nd edition), Water and Environmental Research Institute, University of Guam, Mangilao, Guam, 60 pp.
Holland, G. R., 1980: An analytical model of wind and pressure profiles in hurricanes. Mon. Wea. Rev., 108, 1212-1218.
Krayer, W. R., and R. D. Marshall, 1992: Gust Factors Applied to Hurricane Winds. BAMS, 73, 613-617.
Saffir, H. S., (1972): Evaluation of structural damage caused by hurricanes. Phase 1, Final Report. National Science Foundation, Washington, D. C.
Simpson, R. H., 1974: The hurricane disaster potential scale. Weatherwise, 27, 169-186.

Summary

Typhoon Mangkhut over Rota Island, CNMI. 


Intensity estimate during eye passage = 90 kt G 110 kt (strong CAT 2).  (103 mph G 127 mph, round-up to 105 mph G 130 mph).


Based on:

(1) Dvorak satellite estimate of T 5.0 = 90 kt (CAT 2)

(2) Radar 4000-foot outbound 117 kt, provides upper bound on gusts at 117 kt. (does not yield a category, but does limit the intensity to no more than the lower border of CAT 3)

(3) MIN SLP = 960 mb, consistent with strong CAT 2.

(4) Damage survey consistent with strong CAT 2.

Additional Findings

(1) There was no evidence of hurricane/typhoon transients (e.g., downbursts or tornadoes).
(2) There were some large “NULL” areas on the high-elevation mesa-like plateau of Rota’s Sabana region, where damage was light. Also on the Sabana were some small areas of heavy damage.

Photographic Plates

PDF of Report

Typhoon Mangkhut (2018) Meterological Assessment

Typhoon Mangkhut (2018) Meterological Assessment

View PDF of Report