Dannika Kate U. Valerio, Matt W. Zapata, Nathan C. Habana

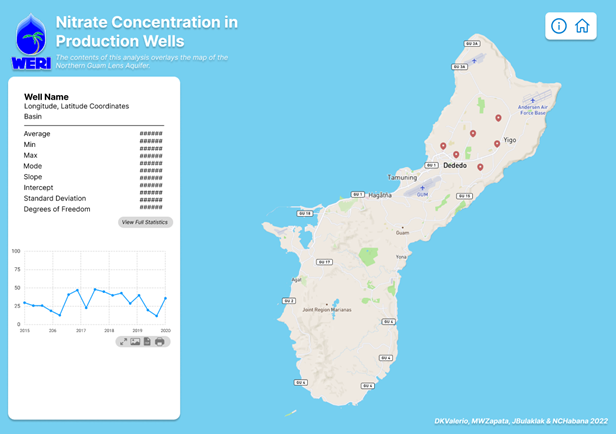
Map of Guam’s Production Wells (active and inactive) Above shows all the located production wells with Nitrate-N concentration records. Marker colors refer to well owner blue (US Military), green (GWA), gray (private).
Select to jump to a section.
Abstract
Background
Methods
MAppFx Prototype Interface Design
Results
Summary Conclusion
Acknowledgements
Brigham Young University, Civil Engineering Department: Riley Hales, Gus Williams, Norm Jones
WERI UOG: Jezreelyn Y. Bulaklak, Joseph D. Rouse, John W. Jenson, Leroy F. Heitz
UOG Web Team: John Wigglesworth, Matthew Raymundo, UOG Web Team, Rommel Hidalgo
Guam Waterworks Authority: Jennifer O. Cruz, N’tasha Perez, Carmen Sian-Denton, Mauryn McDonald, Vangie Lujan, Paul Kemp, Brett Railey, Miguel C. Bordallo
Guam Hydrologic Survey Program, DOI USGS NIWR
One Guam Water Resources Information Program
Abstract
Many water resource research and agencies have longed for an interactive database map as it could be easy for everyone to use and access, especially for deciding water source protection and production management. Interactive web map and graphs are the now and future of online interactive hydrologic database access. This is possible through JavaScript and JS Libraries that are now available for developing interactive web applications. In this intent, an interactive online application, MAppFx, demonstrates a map point and graph display feature. And a recent research product of Guam production well nitrate trends and analysis are the select dataset for developing this new interactive feature that expands the interagency web map products in the Guam Hydrologic Survey website. The product is an online map of Guam production wells as points with well names that upon selection displays a time graph of nitrate concentrations in a panel, or over the map option. The success here will pursue other interactive map and time graph products pertaining to Guam’s water resources, such as the observation well dynamics, chloride and production, rainfall hydrology, and other field surveys.
The goal is to build MAppFx, an interactive map and graph web page interface. The map features production well nitrate concentrations, sampled from Guam’s deep aquifer production wells. The purpose of this map and graph product is to share the information with agency partners, and anyone worldwide who is interested in obtaining the information in an easy to use and access platform. This information is most useful for on demand records reference and research.
Background
The select data of interest, production well nitrate-N records, is pertinent to water quality and may suggest excessive wastewater discharging into the water source. GWA and US Military use deep well pumping and one horizontal (“Maui style”) well to extract up to 42 MGD, about 90%, of utility water from the Northern Guam Lens Aquifer. The Northern Guam Lens Aquifer forms a karstified, uplifted limestone plateau of some 200-500 ft amsl, a solid foundation for civil development and economic access to its water source. However, as the island continues to build atop its most valuable resource, attention and observation of water contamination and integrity of wastewater system becomes increasingly important.
Nitrate-N, as possible wastewater contamination, is the means of observation including the mapping of potential nitrogen sources. McDonald, 2001, made the first nitrate-N and production well data analysis. Twenty years later, Bulaklak and Habana, reevaluated McDonald’s analysis and explored a ranking analysis to determine top 10 wells and areas of concern. The analysis found changes to early trends, and noticed flattening in some wells, and decreasing rate. Bulaklak and Habana proceeded as well to produce the first
WERI Web MApp collection, shows a summary of production well nitrate-N increasing or decreasing. Bulaklak et al, 2021, produced a Scientific Advisory Report on the findings for the legislature that was published in the Guam Post.
The ever-growing presence of data has led to the advancement of data visualization tools and platforms, allowing for information to be readily and easily shared. One of the key components behind the call to visualize data is JavaScript, providing a website’s sophisticated and interactive nature. The latter, thanks to existing JavaScript libraries, such as AM Charts, Leaflet, Data Wrapper, and Plotly, provides a streamlined experience for the user to interact with the data. One of the leading examples of these dashboard-like interfaces with a map and graph include Google Map, Google Earth, and stock market charts. The combination of these features and tools for user interaction is beneficial to science and research efforts. This is best achieved with a master web developer and scientist—or one with both skills. By using data visualization tools, research can neatly display big data analysis online and make it a reference, eliminating the need to include everything in the appendices.
Methods
The programming concept is a map of production wells, where a particular well on the map, upon selection results in a pop up with a button that opens an information, statistics, and graph of the nitrates data panel. The panel is scrollable, and at the bottom an option to open a large view of the graph that is positioned center, ontop of the map. Both the map and graphs are interactive. The page design is intuitive and user friendly.
MappFx Prototype Interface Design
MAppFx is a web application program composed of HTML and clever JavaScripting to access JS Libraries and JS Object Notation (JSON). The interactive interfaces are JS Libraries, Leaflet® for the map and Plotly® for the graphs. The JSON is the lightweighted database notation system, which contains the nitrate-N statistics and chart information for its respective production well. Details to the composition of the code and programming flow diagram is available in the technical report.

Results
The first MAppFx product is now available online, and residing in this website – Guam Hydrologic Survey, Guam’s online repository of pertinent hydrologic information.
MAppFx interface. See the results here>>
Summary Conclusion
MAppFx is a new data visualization product of WERI, UOG that provides a map of Guam’s production wells with nitrate-N data and its graph. Both map and graphs are interactive and is now available online on the Guam Hydrologic Survey website. The first training was provided at the WERI Water Resources Forum on Guam in November 2022 (see video above). Chapter 4 (Technical Report 180) also provides details to a user interface guide. WERI interagency partners, Guam Waterworks Authority, Guam Environmental Protection Agency, NAVFAC Marianas, Legislature, Guam Department of Education, and the private sector now have access to an intuitive online data visualization product. Interagency partners may easily refer to this online product to discuss, strategize, and manage water source protection. With this major accomplishment, a modern means of information transfer, other MAppFx production well information products are now possible and will soon be available for everyone.
