Water Availability
Natural Recharge Rate
The current estimate of recharge (on an average daily basis) for the NGLA is 238 million gallons per day (MGD) (Johnson, 2012). Total production ranges from 35 to 40 mgd, or 15 to 17% of average recharge. An informal rule of thumb among groundwater hydrogeologists is that no more than 30 to 40% of natural recharge can generally be economically extracted from an aquifer. Given that the most accessible and productive locations are usually the first to be developed, the costs of new development begin to rise rapidly past this threshold as increasingly remote and less productive sites are all that remain to be developed.
Although the total recharge to an aquifer certainly imposes an ultimate physical limit on production, practical limits are generally imposed by the increasing marginal costs of developing production capacity beyond about 30 to 40% of natural recharge. By the previously noted rule of thumb, extraction from the NGLA has thus likely reached roughly 50% of its practical limit. That said, there are two additional considerations for defining practical limits to production system capacity: distribution efficiency, and degradation of water quality as extraction increases.

NGLA Production Rates and Estimated Sustainable Yields
The sustainable limits are based on recent (2015-present) modeling results. The estimated sustainable yield is subject to change as model resolution increases. These limits (70-80 MGD) are for the “best possible case scenario,” in which all of the production wells are in the parabasal zone.
As production goes up, salinity increases – and at about 70 MGD, even with the best system, the limit of acceptable salinity (250 mg/l chloride) is pushed. By 80 MGD the system is pushed right to the limit. The real system, in which not all of the wells are para-basal, will get salty faster than this ideal system, as shown in a 2013 USGS-WERI modeling study. These numbers for the ideal (i.e. 100% parabasal) system at least gives some perspective for the longer term, in principle at least, toward emphasis on development (and protection) of the parabasal zone.
System Leakage Rate
Currently, about 45-50% of GWA production is unaccounted-for water, i.e., water either leaking from distribution lines before it arrives at a meter, or taken by unmetered users (i.e., illegal hook- ups) (GWA data, GHS database). If one assumes that 20% of unaccounted- for production goes to unmetered users, then some 40% of production could be leaking back into the aquifer.
Given that the industry standard for pressurized distribution lines acknowledges that minimum leakage is about 15 to 20%, then up to 8 to 10 mgd (20 to 25%) of current production might eventually be captured to satisfy growth in demand simply by fixing distribution line leaks rather than by bringing new wells into service. Whether development of additional production wells is more or less costly than detecting and fixing leaks, however, depends on the relative marginal costs of capturing an additional unit of leaking water versus developing an additional unit of new production.
Water Quality
Salinity Limits
In coastal island aquifers, there is actually no limit to the amount of water that can be pumped from the aquifer, but the inevitable rise in groundwater salinity that accompanies increasing production imposes yet another practical limit on production system capacity. WERI studies of salinity patterns and trends in the NGLA (McDonald and Jenson, 2002; Simard et al., 2012) have shown that salinity in wells varies according to well location, depth, and pumping rate, and can also be affected by seasonal and interannual changes in rainfall and sea level.
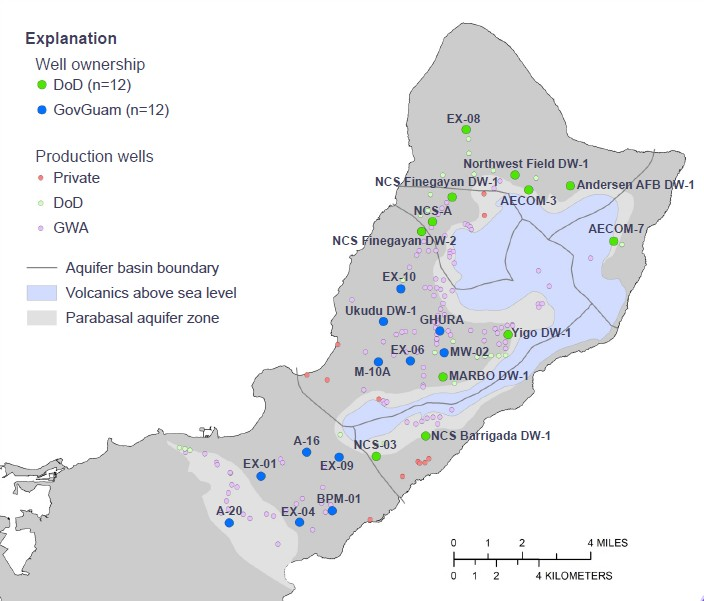
Salinity is measured and managed in terms of chloride ion concentration, for which the USEPA Secondary (recommended, rather than enforced) standard is 250 parts per million (ppm), which is equivalent to 1.3% seawater. The 1982 Northern Guam Lens Study (CDM, 1982) recommended a benchmark maximum of 150 ppm (0.8% seawater) as the local engineering design standard for NGLA wells in the basal zone. Figure shows the current chloride concentrations reported for production wells in the NGLA. Table 3 shows number of active wells, production rates, and production-weighted average chloride for each of the aquifer’s six basins.
Managing Salinity
There are at least four options for managing salinity in drinking water delivered at the tap: 1) replacing high-salinity wells with new, fresher wells; 2) diluting high-salinity water with sufficient low-salinity water to bring the chloride concentration at the tap within the USEPA standard (250 ppm) or local benchmark (150 ppm); 3) reducing pumping rates at wells that show high sensitivity between salinity and pumping rates; and 4) desalinating brackish well water through processes such as reverse osmosis. A fifth option would be to conserve fresh water by providing incentives for high-density housing near the coast, such as Tumon hotels and condominiums, to use seawater for flushing toilets (which accounts for about 20% of household water use (AWWA, 2014)). Which of these options is most economical depends on the relative marginal costs of achieving the desired reduction in salinity for a given unit volume of water. Over the long term, some combination of these approaches might best be used for optimization of water production capacity and water quality.
Long-Term Investment in Hydrogeologically Optimum Locations
Finally, policy-makers should be aware of the relative advantages of developing the aquifer’s para-basal zone over the long term. Wells set in the para-basal zone can be set deeper and pumped harder than wells in the basal zone, and thus tend to be more efficient. Moreover, although it comprises only 5% of the aquifer, the para-basal zone captures all the water descending from the 25% occupied by the supra-basal zone. The supra-basal zone is invulnerable to salt-water contamination, and the para-basal zone is much less vulnerable than the basal zone. Ongoing groundwater modeling work at WERI (Superales et al., 2018) suggests that if it were possible to concentrate all of Guam’s water wells (some 120) in the para-basal zone (which would also require realignment of the main distribution lines) that the aquifer could produce some 80 mgd at less than 150 ppm chloride – which would compromise about 33% of average natural recharge, and about twice the present production of up to 40 mgd, for which the production-weighted average chloride is about ppm.


Sewage Threat
With the Northern District Wastewater Treatment Plant (WWTP) servicing much of the Dededo area, treated effluent is discharged via an outfall to the ocean, thus avoiding any threat to the NGLA. However, leaking sewer mains in the collection network have been, and will no doubt continue to be, a significant source of contamination to the underlying groundwater. In addition, most of the northern Guam region is not tied into the WWTP, but rather is serviced only by individual family septic tanks. These units are coupled to tile fields that disperse the semi-treated effluent over an area that allows for natural treatment to occur, before percolating down to the groundwater table. With the vadose zone over the groundwater table being several hundred feet thick in places, there is potential for additional natural treatment to occur.
With organic-bound nitrogen in the sewage entering the environment and releasing the nitrogen in ammonium ion form, all data to date shows that it is all being converted to the nitrate form before it reaches the groundwater. This indicates that the vadose zone is indeed biologically active and supporting conversion of the ammonium by microbial oxidation (i.e., nitrification) as well as the elimination of other organic materials in general. It is our hypothesis that most of this activity occurs in the epikarst (the first 20 to 60 ft of the vadose zone with 40% or more porosity containing pockets of sediment/soil and being well saturated with water. Recent studies suggest that no short-term (daily, weekly) variations in nitrate levels are occurring, but efforts to acquire more data and to accurately map the historic trends are ongoing. This will help us understand where changes in water quality might be occurring, both by location and over time. In the meantime, water being pumped from the NGLA is regularly monitored for pathogens and ntirate nitrogen to confirm its suitability for use as the drinking water source for up to 90% of the population.
PFAS Situation
Recent results of the Unregulated Contaminant Monitoring Rule 3 (UCMR3) reveal three Guam Waterworks Authority (GWA) production wells to be contaminated with perfluorooctanesulfonic acid (PFOS). One of these wells (NAS-1) is located inside of the former Naval Air Station at Tiyan, Barrigada. PFOS concentrations found in this well to date range from 67-110 ng/L. The two other wells (A-23 and A-25) are located in Hagatña, one of the oldest villages on Guam. PFOS concentrations determined in both of these wells to date are consistently above 70 ng/L with maximum levels occasionally exceeding 400 ng/L in well A-25. Both wells are currently off-line. Ongoing PFOS source studies have so far identified four potential contamination sites based on historical records and favorable hydrogeological properties of the surrounding area.
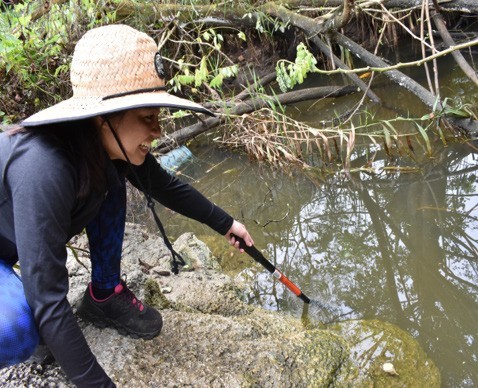
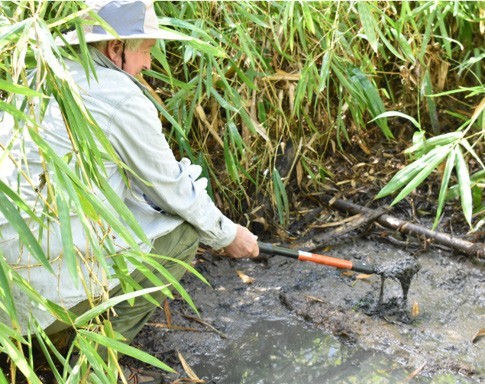
These sites include: 1) a defective wastewater pump station that leaked millions of gallons of wastewater into the Chaot River over a 25-year period, 2) Agana swamp which drains the Chaot River and where chronic illegal dumping has occurred since WWII, 3) neighboring ponding basins that direct stormwater into the underlying aquifer, and 4) a nearby air flight crash site. Soil/sediment samples were retrieved for analyses of PFOS and other five unregulated perfluoralkyl substances (PFAS) from 22 sampling sites overall. 4.8 ug/Kg of PFOS was detected with the highest level among all sampling sites at one of ponding basins near the Well A-25. 28.29 ug/Kg of six PFASs (sum) was the highest near the GWA wastewater pump station.
