Guam Public Laws 24-247 and 24-161
In 1998, the 24th Guam Legislature enacted Public Laws 24-247 and 24-161 as the Guam Hydrologic Survey (GHS) and the Comprehensive Water Monitoring Program (CWMP), respectively. These two laws were ratified in response to an El Niño event in 1998, resulting in a prolonged drought that advised water rationing practices. CWMP addresses the need for continued collection of hydrologic data and GHS to conduct more hydrologic and water resources research. WERI is charged with administering the annual legislative appropriations necessary to facilitate, direct, and implement the program’s primary objectives. Both programs are now integral to the WERI water resources research, information dissemination, education, and training mission.
The foresight of the Guam Legislature in creating these two vital programs deserves special mention. Through their efforts and continued support, WERI advances in consolidating and interpreting several essential water resource information, constructing hydrologic information for Guam, and revitalizing the USGS water resource monitoring program. Our understanding of the complex physical, chemical, and biological processes that influence Guam’s water resources has broadened, and the increase in graduate student research opportunities provided by the programs contributed to the number of highly trained water resource professionals in the island’s workforce.

Guam Hydrologic Survey Program (GHS)
The purpose of GHS is to consolidate all of Guam’s available hydrological data gathered by local and federal government agencies and consultants, and to conduct research on water-related issues of local importance. GHS also funds a variety of water resource educational programs in various formats, including guest lectures and seminars at UOG and in the community, informational and training workshops for teachers and professionals from other government agencies, field trips and talks for students, and the publication and distribution of educational posters, maps, and fact sheets. In addition, GHS also funds research assistants and associates who engage in CWMP activities, including fieldwork with USGS’ observation well data collection, and phreatic groundwater and hydrologic data analyses.
For twenty-seven years, WERI has continued to operate and administer the GHS Program. The GHS and CWMP Annual Reports are now available online on the GHS website.
WERI serves numerous island agency partners through the GHS Program, attending legislative hearings, providing research findings, sharing hydrologic and geologic maps, and advising on water resource concerns. Through the GHS Program, reliable research-based information can be achieved. Therefore, the Guam Legislature, Guam Environmental Protection Agency (GEPA), Guam Waterworks Authority (GWA), NAVFAC Marianas, and the Groundwater Resources Development Group (GWRDG) are more confident in determining management plans, actions, and regulations involving our water resources. WERI shared water research findings and advised agencies on wastewater issues, aquifer capacity, hydrogeologic assessments, surface hydrology, saltwater intrusion, and the new online data visualization products.
WERI provided GHS outreach to the Northern Guam Soil and Water Conservation District, GWA, the Legislature, Guam DOE, visiting universities, and the private sector with the Virtual Tour into the Northern Guam Lens Aquifer. Post social distancing protocols, in 2024 the GHS Program, with the services of Global Learning and Engagement (GLE UOG), WERI resumed the Northern Guam Lens Aquifer Virtual and Site Tour.
WERI continues to expand GHS interagency support through its online web products. Since developing the GHS website in 2016, WERI manages and produce new hydrologic reports, presentations, maps, and databases.
WERI continues to develop new online data visualization products—a new means of sharing hydrologic data through interactive maps and graphs, such as WERI Web MApps and MAppFx.
Comprehensive Water Monitoring Program (CWMP)
The CWMP is the core of essential water information, through approved measurements and analytic methods, the basis of hydrologic research interpretations. The CWMP was created to gather data on saltwater intrusion and water lens profiles in Guam’s sole source aquifer in the northern part of the island. Stream flow data and other parameters associated with surface waters are collected in the south. Moreover, the program collects rainfall data for hydrologic, meteorologic, and climatologic studies. These are essential for determining sustainability assessments and water supply capacities.
The CWMP rehabilitated data collection assets that fell into disrepair. CWMP allowed WERI to obtain services from USGS Pacific Island Water Science Center (PIWSC) to collect, organize, and manage hydrologic data from stream gages, rain gages, and observation wells. Government of Guam and USGS PIWSC funds the CWMP, restores the Federal/State Territory cost-sharing for continued hydrologic monitoring.
USGS PIWSC methods ensure that data are frequently and reliably collected, analyzed, and made widely available. Most data from USGS gages are readily accessible online. PIWSC collected hydrologic information for Guam are consolidated, quality is marked with provisional and approved, and made available online: http://hi.water.usgs.gov
CWMP data is analyzed and interpreted. GHS employs research assistants and research associates to organize, analyze, and interpret CWMP data. CWMP is essential to GHS projects that processes and analyzes and interprets the collected data.
GHS and CWMP Organization and Operations
GHS and CWMP are organized by a program management team that involves the WERI Director and a support panel of WERI Faculty subject experts, the Program Coordinator, Operations Manager, and the Program Advisor. The WERI GHS and CWMP Programs continue to improve and may also change the internal organizational structure yearly to streamline operations management, processes, and product output. The organization is also crucial for determining the program’s resource requirements, project focus, and annual budget. The figure below is an internal WERI GHS and CWMP personnel and process diagram.

GHS analyzes water resource data for investigative research and the production of reports. WERI Faculty proposes GHS projects annually and supports a research assistant to conduct a GHS-related project. This opens opportunities for a research assistant to do a master’s thesis through UOG’s Environmental Science Program. GHS also has an Information Management team that oversees and develops both the WERI and GHS websites. The Operations Manager collects project summaries from faculty projects, CWMP projects and activities, and Information Management, and manages the organization and drafting of the GHS and CWMP Annual Reports.
Research Team
Mary Clare Snaer
Environmental Science Graduate Student
BS Biology, Guam
Advisor: Dr. Nathan Habana
Hydrologic analysis of deep observation wells, NGLA
CWMP Digital and Field Research Assistant
Risel Uludong
Environmental Science Graduate Student
Research Assistant
Advisor: Dr. Yuming Wen
Groundwater Protection Zone
Nicole Mathews
Environmental Science Graduate Student
Research Assistant
Advisor: Dr. Yuming Wen
Landcover Analysis
Jovic Aaron Caasi
MS Mathematics, Washington
BS Mathematics and Computer Science, Guam
Supervisor: Dr. Nathan Habana
Groundwater Modeling Systems (GMS) Model Developer and Testing
Research Assistant
Atasha Bautista
Undergraduate, Chemistry and Biology, Bio-Medical Track, Guam
Supervisor: Dr. Nathan Habana
Groundwater model preparation and application, GIS spatial, feature analysis and organization
Research Assistant
GHS Information Management Team
Dannika Kate U. Valerio
BS Computer Science and Communication, Guam
GHS Information Manager
Lead GHS and WERI website organization, design, programming, data visualization products design and programming, WERI News
Sydney M. Quintanilla
Undergraduate Computer Science, Guam
Digital Assistant
Assists with websites design, update, and hydrologic data organization, programming, and management
The GHS operations and administration has posted job announcements to fill a few more research assistant/associate positions in the information management (1 Digital Assistant) and CWMP (1 CWMP Research Associate and 1 Research Assistant) sections. Job announcement for Research Assistants for research (and thesis) projects are posted as well at the UOG website (HRO Online Employment Portal).
Guam Hydrologic Survey Report
The Water and Environmental Research Institute of the Western Pacific continues to operate and manage the Guam Hydrologic Survey (GHS) and Comprehensive Water Monitoring Program (CWMP). The following are data and research product report status of GHS and CWMP for Fiscal Year (FY) 2025. GHS continues with the online information management systems and operations to organize and make hydrologic and water resources information available online. Information management includes development of online interactive data visualization products, MAppFx and Web MApps. GHS also has hydrologic research components and outreach programs. Hydrologic research investigates vulnerabilities, resilience, and sustainability of water resources under known environment and climate conditions. The research also focuses on data collection, organization, analysis, and interpretation for determining sustainable practices. Then the ongoing/completed scientific research, recommendations are presented through WERI GHS outreach and educational services.
GHS Information Management
D.K.U. Valerio, S.M. Quintanilla, and N.C. Habana
The Information Management (GHS IM) develops the GHS website, which is the worldwide interface for accessing Guam’s available hydrologic information. The secure website is a UOG web domain, and the address is: guamhydrologicsurvey.uog.edu
University of Guam’s (UOG) Web Team, Office of Information Technology (OIT), manages the GHS website security and hosting. The content management system, development platform, is WordPress®. The GHS Program addresses an accountable task in public law—dissemination of Guam’s pertinent hydrologic information.
WERI leads the island with an online hydrologic information system for local interagency partners and anyone’s interest worldwide. The effectiveness of the website is expressed by interagency partners who mention referencing the online information. The GHS website superiorly improved program management with data and information organization, improved information access, and reduced the need for printing. The GHS IM team organize, design, develop, apply computer programming to the website’s interface and online data visualization.
GHS Website Migration and Updates
As mentioned above, the GHS website is undergoing a migration to a more secure and reliable platform. This is to ensure there are no security vulnerabilities and that the site is compatible with modern website standards. At the same time, the GHS Information Management team is in the process of rolling out major updates to improve performance, reliability, website features, and cross-platform accessibility to enhance browsing experience. During this transition, users visiting the old GHS website may experience temporary interruption or limited functionality. Currently, a message appears on the GHS website notifying users and visitors of the ongoing site construction.
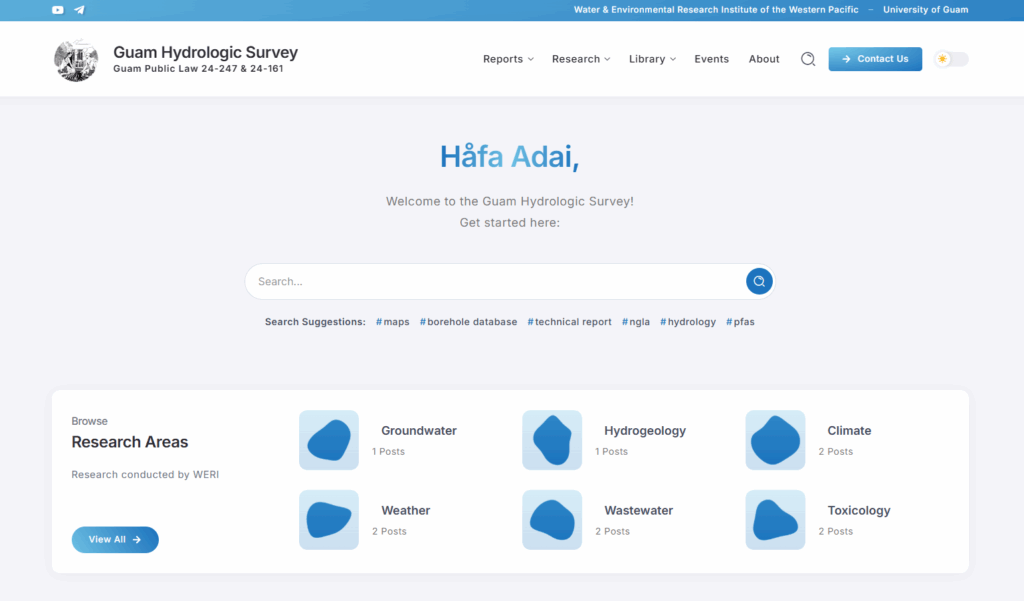
The appearance of the new GHS website takes on a fresh look that is responsive to different devices, such as PC desktops, tablets, and mobile phones. In addition, dark mode is included as a feature to increase comfort and usability. It can be toggled through a switch found in the main menu bar on the top of the page.
The new and improved GHS website will house the same content from the previous site, but the content and navigation adopt a different structure.
The menu bar towards the top of the bar still stands as the main form of user navigation with an updated look. Its content was condensed into five main sections: Reports, Research, Library, Events, and About. In addition, the search bar has been improved next to the Contact Us button.
Upon hovering over the Reports link in the menu bar, it reveals 4 sections: GHS Annual Reports; State of the Aquifer Reports; Research, Education, and Outreach Agendas; and Sustainable Management Reports. Below each of these sections, the most recent reports appear for convenience.
When hovering over the Research link in the menu bar, it reveals 4 research areas—Groundwater & Hydrogeology; Hydrology; Climate & Weather; and Wastewater & Toxicology. Below each of these sections, the most recent posts appear for users to browse through. The user can also click on the name of the research area, which will lead them to all the available posts for that research area.
Hovering over the Library, users will see the 5 different sections, which include the following: Sort & Search, a PDF library for WERI publications; Presentations, a library containing PDF and PowerPoint files from WERI workshops and advisory council meetings; Maps & Posters, a library containing historic maps and Google maps; Web MApps, which features interactive maps from WERI and interagency partners; and MAppFx, which are interactive maps and data visualizations created by WERI. Links to databases, such as the Borehole Database (BHDB) and Chloride and Production Database (CPDB), also pop up in this section for convenience.
The front page greets users with a convenient search bar to lookup available resources, a section highlighting the most recent research projects conducted by WERI, and sliders that spotlight the latest Web MApps and MAppFx projects available. Towards the bottom of the page are links to available resources—such as the extensive library, database, and reports. These items are also accessible in the main menu bar.
The new site is under active development, so styles and appearance of features may shift as the team experiments with design iterations. The content migration is expected to be complete by the end of this year, and refinements to the site’s overall layout and design will continue into the next year.
Northern Guam Lens Aquifer Production Well Nitrates
D.K.U. Valerio, M.W. Zapata, and N.C. Habana

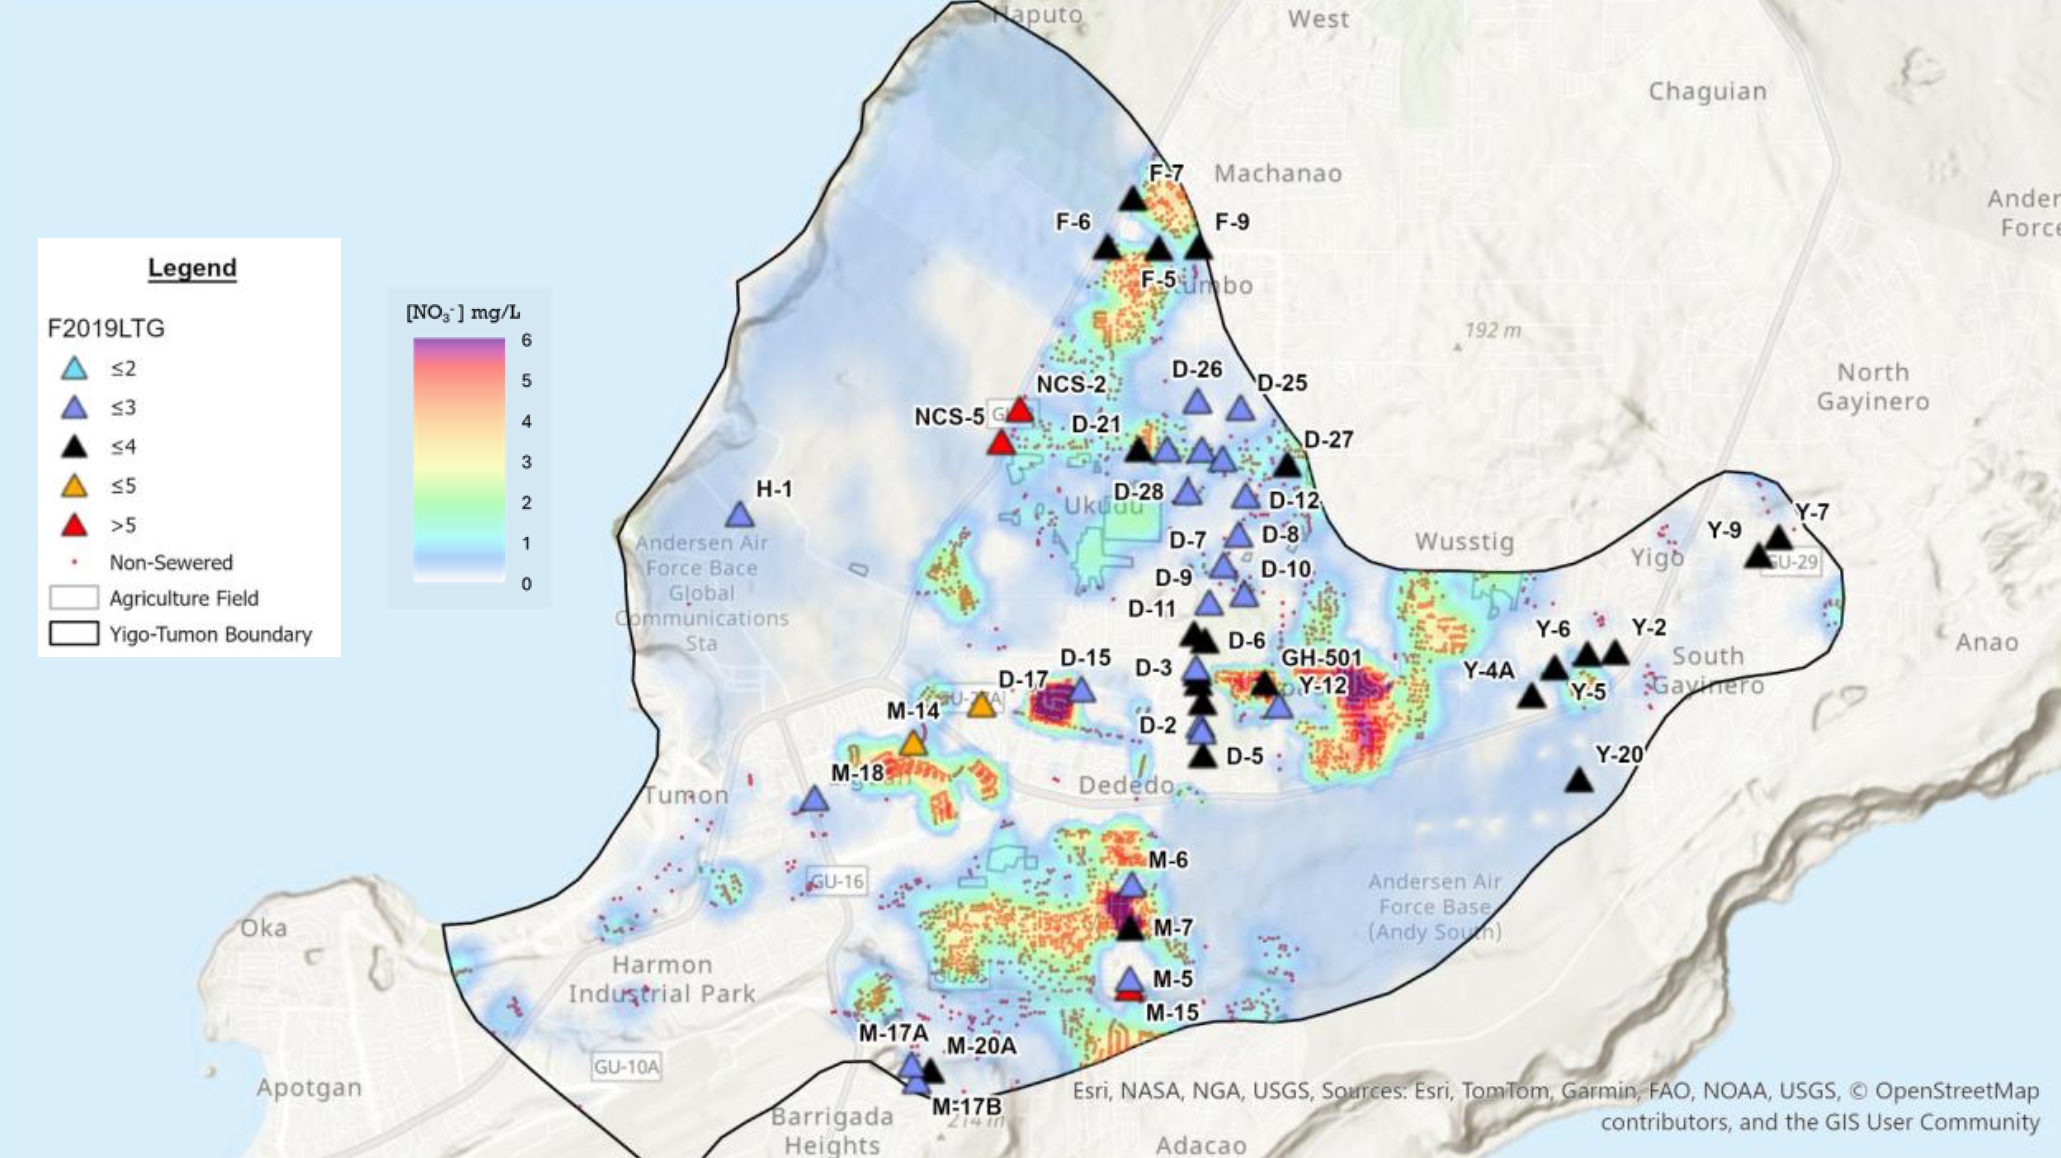
Many water resource researchers and agencies have longed for an interactive database map that is easy to access, especially in discussions and decisions for water source protection and production management. Web development tools, namely JavaScript libraries and frameworks, offer a rife range of resources to create interactive map and graph platforms. With the availability of these tools, the WERI GHS IM team can pursue avenues for online hydrologic databases. This led the team to develop data visualization interface that features a map of survey points, or areas within polygons or polyline boundaries, with historic data. To store the map’s geographic metadata and data for the plot, a JSON (JavaScript Object Notation) file was used. As a result, the first data visualization product in the MAppFx series, which features an interactive map of Guam’s production wells and nitrate data, which was based on a WERI research by J. Bulaklak and N.C. Habana (2021). Users can interact with the map through layer toggles, drawing tools for highlighting select areas or presentation purposes, and information panels detailing statistical analysis and time series plots of available nitrate data.
This MAppFx was completed in 2023, but updates to the nitrate data are in progress. The data updates are pending as onboarding and training for a new WERI GHS IM team member are currently underway for the transfer of information. Once training is complete, the latest data will be incorporated into the MAppFx’s JSON database.
Southern Guam Watersheds - Streamflow Duration Curves
N.C. Habana, L.F. Heitz, and D.K.U. Valerio

Southern Guam’s watersheds and streams may have potential for energy and/or water supply development. Streamflow variability and flow duration analysis are useful information to determine such potential. Flow variability and flow duration curves were quantified directly from gaged sites and ungaged reaches, using inferential techniques (Heitz et al. 2016 and 2017, WTR 154 and 164, respectively). This project expands the MAppFx: Ugum Flow Duration Curves (Habana et al. 2023, WTR 181), into the entire southern Guam (14 watersheds and 19 stream gages). To obtain proper watershed and stream topology, the technique required modifying the GeoJSON file, expanding its data nesting configuration. All the assessed gaged streams in southern Guam are now available online. The use of the interactive web map and graph interface was demonstrated in the Guam Hydrologic Survey WERI Workshop in September 2024. More than 40 interagency employees learned about the use and access of MAppFx products in the WERI Workshop 2025. The technical report is underway
Chloride and Production
M.W. Zapata, D.K.U. Valerio, and N.C. Habana

MAppFx production well chloride concentration is one of the latest WERI data visualization products. Chloride and production rate data visualization was developed soon after the MAppFx for production well nitrate level [Valerio et al. 2023, WERI Technical Report (WTR) 180]. Chloride is another very important production well constituent like nitrate, that chloride may also limit production. GWA tests wells for chloride concentration, since high levels of chloride is often a result of saltwater intrusion. Chloride translates to salinity, a water quality aesthetics concern, often a result of drawing excessively from a freshwater lens. The management of water quality and production includes the observation of changes in chloride of utility water production. Guam uses about 100 deep vertical wells to extract more than 38 MGD of utility water from the Northern Guam Lens Aquifer (NGLA). The MAppFx Chloride web interface opens with a layer version of the Northern Guam Lens Aquifer map (Habana and Jenson 2018) and Guam Waterworks Authority (GWA) production wells.
The JSON, JavaScript Object Notation (data form file), for this online application was configured for plotting chloride and production data over time (date). An Excel file is used to organize GWA data, and the Excel program generates the JSON file. This makes ease of managing chloride and production data that can be updated quarterly and serves as a state of the aquifer component.
This data visualization product is coded to provide a summary interface of production weighted average chloride and total production for each aquifer basin in the NGLA. The well points on the interactive map utilize symbology based on the latest data chloride concentration (mg/L or ppm) and production rate (GPM). Side panel widgets are available as well for symbology and summary. The symbology panel is interactive that one can select to activate wells based on concentration and production rate. The summary panel is the annual production well rate (MGD) and production weighted average chloride concentration for each of the 6 aquifer basins in the NGLA. Selecting each aquifer basin in this panel expands to a last 10 years of annual summaries showing total production and weighted average chloride. Upon selecting a well point on the interactive map, an interactive double axis chart appears showing the historical positive concentration, production, and their respective trend line. This MAppFx product was presented in September 2024 to the American Water Works Association, Hawaii Western Pacific Sub Section, and training for use was conducted at the Guam Hydrologic Survey WERI Workshop to interagency partners. The next task is to try to include the military wells. The technical report is underway.
Updates to the chloride and production data for this MAppFx are in progress. With a new WERI GHS IM team member aboard, these data updates will be available once the training for information transfer on the JSON database and MAppFx interface is complete. When the latest data becomes available on this MAppFx, users will see an updated statistical summary in the well’s information pane as well as the chloride and production levels collected by GWA in the time series plot.
Deep Observation Wells
M.W. Zapata, M.C. Snaer, D.K.U. Valerio, and N.C. Habana
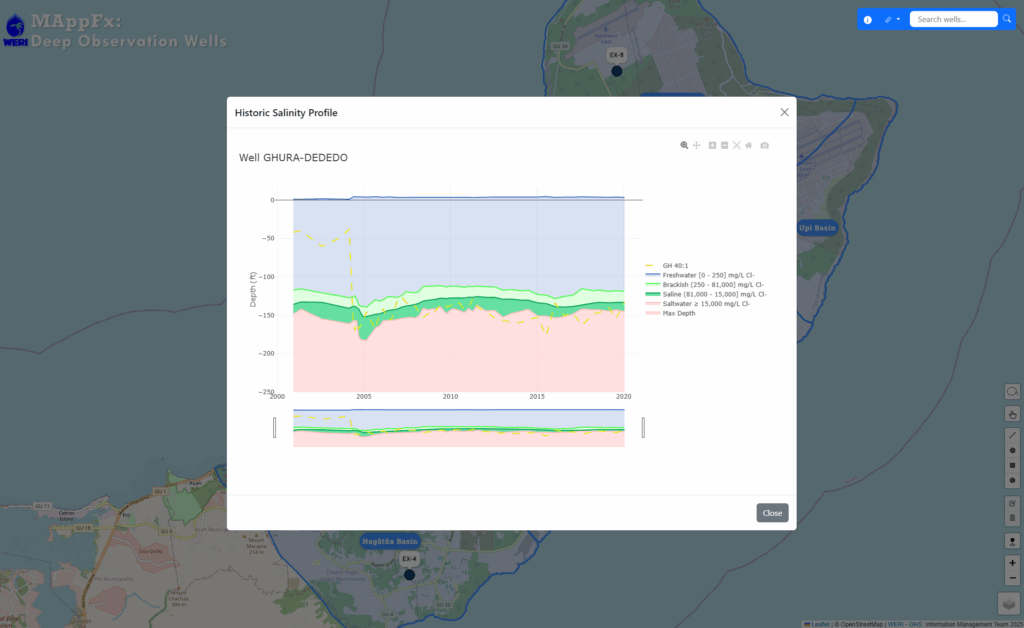
Deep observation wells (DOWs) are phreatic access ports for conducting salinity profiles in the NGLA. A DOW is a vertically positioned tubular structure that extends down a borehole with perforation below the saturated zone, penetrating the freshwater lens, extending into the saltwater zone. This allows for a depth and conductivity analysis that translates into a salinity profile. The salinity profile sampling is done at least twice a year. This operation was conducted as part of the WERI-USGS data collection under the CWMP. Dougher et al. (2019, WTR 168) developed the first historic graphing of salinity profiles for three DOWs in the Tomhom Aquifer, NGLA. The report defines the phreatic zone of freshwater, transition zone, and saltwater. Dougher’s research revealed the capacity and durability of the aquifer that went through a major recharge event from typhoons, followed by a 6-year drought. In 2024, the WERI GHS IM team started developing the historic graph of phreatic zone for the DOWs as a component of the MAppFx web app. On the MAppFx interface, users see 8 DOW historic profiles that began in 2001. In the future, it will include the newly installed DOWs of both GWA and Military. The WERI GHS IM team was able to create a workflow that converts the raw Excel data to MAppFx’s input and database file, JSON. This system is easy to manage and update when new data is received. DOW salinity profiles alone are difficult to analyze and present in such a way that could be well understood. Historic salinity profiles provide a better and valuable insight for determining the status of the aquifer, showing changes in freshwater lens thickness in response to drought and ample recharge. MAppFx makes this easier to visualize and support with the management of the island’s major water resource.
Saipan, CNMI - Production Well Nitrates and Chloride
M.W. Zapata, D.K.U. Valerio, and N.C. Habana


Two MAppFx products were created for Saipan, CNMI using the production well nitrates and chloride data, respectively. The WERI GHS IM team developed a system to organize the raw data, an Excel file, and convert it into a JSON file as an input into the MAppFx interface. The map features an interactive map of Saipan with production wells as the points of survey. Each well is color coded based on a system of values provided by the Saipan BECQ team and can be toggled on and off through the map’s legend and layer control widget. Its graphs display available data for the site that users can also interact with.
It essentially takes on the same codebase as the Chloride and Production MAppFx for Guam, but with a new selection feature, which was requested by the Saipan BECQ team. This selection tool allows for the user to select multiple wells and view all the graphs in one pane. Having this view helps provide a summary when comparing data between select wells in different regions. To trigger this tool, the user would select the lasso widget towards the bottom right of the screen. This MAppFx was presented at the WERI Advisory Council Meetings and was met with positive reception from the audience.
Updates to the existing nitrate and chloride data for this MAppFx are pending. Training is in progress for a new WERI GHS IM team member to ensure a smooth transition of the data process between Excel and the MAppFx platform. Upon the completion of training, users should see the latest nitrate and chloride data available of the respective MAppFx products for Saipan.
Pohnpei and Kosrae, FSM - Stremflow Duration Curves
N.C. Habana, L.F. Heitz, and D.K.U. Valerio
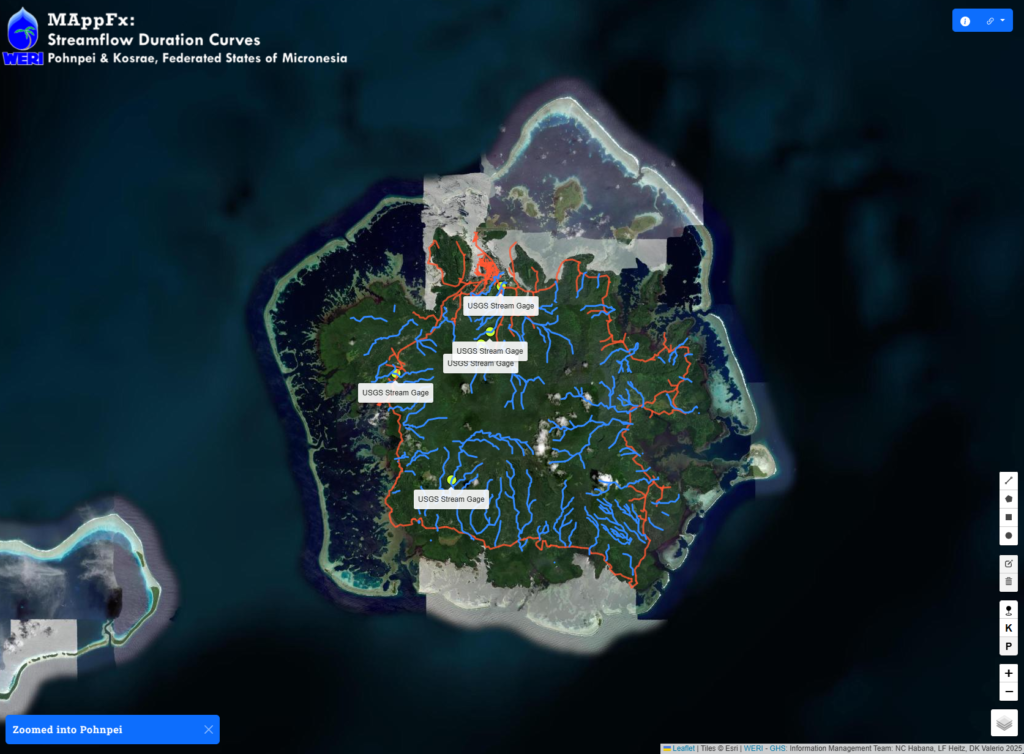
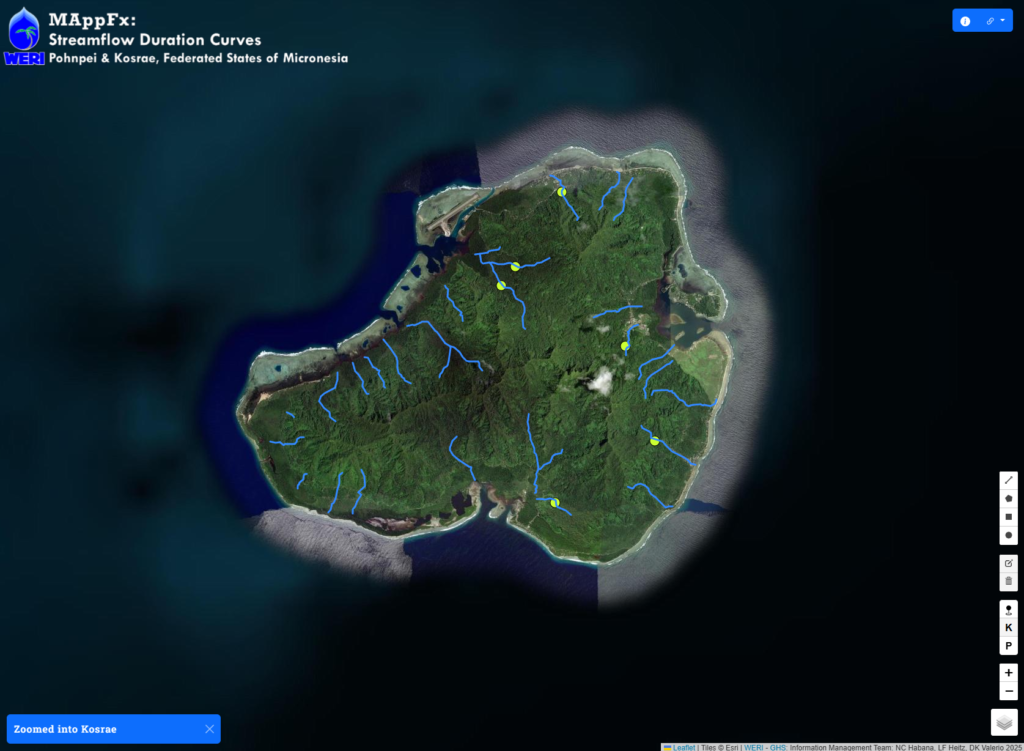
A MAppFx was created for FSM, namely Pohnpei and Kosrae, which features streamflow duration curves. After showing the Saipan, CNMI MAppFx projects at the 2024 AWWA Conference (Hyatt, Tumon), Yap representatives expressed their interest in converting their data into a MAppFx product. Earlier this year, the WERI GHS IM team completed this MAppFx for the FSM. When the page first loads, the map zooms out to have a view of the two islands—Pohnpei and Kosrae. The user can click on one of the islands to get a zoomed in view. Another option to “fly” between the two islands is by using the navigation widget located on the bottom right of the interface. The button labelled as “K” zooms into Kosrae, and the button labelled as “P” zooms into Pohnpei. At its core, this MAppFx maintains the same code as the one for the Southern Guam Watersheds Streamflow Duration Curves but has been refreshed with reusable code blocks and functions.
To access this MAppFx product, a new section for FSM was created on the GHS website. From the menu bar, hover over Library > MAppFx. On the MAppFx page, click on the FSM link to scroll down to the map. A technical report for this project is underway.
Geology Photo Gallery
D.K.U. Valerio and N.C. Habana
One of the latest MAppFx projects underway is the MAppFx Geology Photo Gallery. Compared to the other web maps in the MAppFx series, this one takes on an entirely new approach in its database system. While a JSON file is still used to store the geographic data for the map, this MAppFx utilizes JavaScript API (Application Programming Interface) calls between the backend—the server and data store—and the user interface (frontend) parts of the app that communicate the user’s selection from the map and the metadata for the set of photos to be presented onscreen. In addition, the backend is organized through a directory system. This approach will be easy to manage with future photo collections. Any updates would be a simple drag and drop of photos in their respective folder. The premise of this MAppFx is to have survey points, either a singular site or region represented by polygons. When a user clicks on a map feature, they’ll be able to access photos related to that site. These photos will be displayed as a gallery of geologic samples or site visits that the user can browse through.
Currently, there is a working demo of its two core features—the map and the photo gallery components. However, there are some major challenges in developing a secure backend access to the photo directory and sending the photo set back to the MAppFx interface. The WERI GHS IM team is actively working with the UOG Web Development team to set up secure data endpoints and ensure there are no vulnerabilities where this MAppFx will be hosted, which is the GHS website.
Developments to the photo directory structure are ongoing and will continue into the next year. Refinements to the overall design and appearance of the MAppFx will take place in tandem to ensure a smooth experience for the user. Once this MAppFx reaches production-ready status, that is, where it is live online and users will be able access it through the GHS website, training will be done for WERI GHS IM members to maintain the photo database and API endpoints in the JavaScript code.
Hydrologic Map of Guam Watersheds
N.C. Habana, D.K.U. Valerio, M.C. Snaer, and L.F. Heitz
A high-resolution surface hydrologic map is invaluable for watershed planning, environmental and water resources protection, preservation, and determining strategies for sustainable development. With the success of producing a high-resolution map of the surface hydrology of northern Guam’s limestone plateau (Habana et al. 2022), stake holders expressed the need to include the terrain and hydrologic spatial analysis for southern Guam. The northern Guam surface hydrology techniques were applied to southern Guam, using the latest 2020 DEM, and the results are astounding, resulting in a high-resolution watershed map of southern Guam. The final product is complete and is the most comprehensive surface hydrology map ever produced. Intricate details include runoff paths, enhanced terrain texture, internal watershed features, size categorized watersheds, fill areas or surface depressions, and coastal watershed feature details. This map is now available on the Guam Hydrologic Survey website.
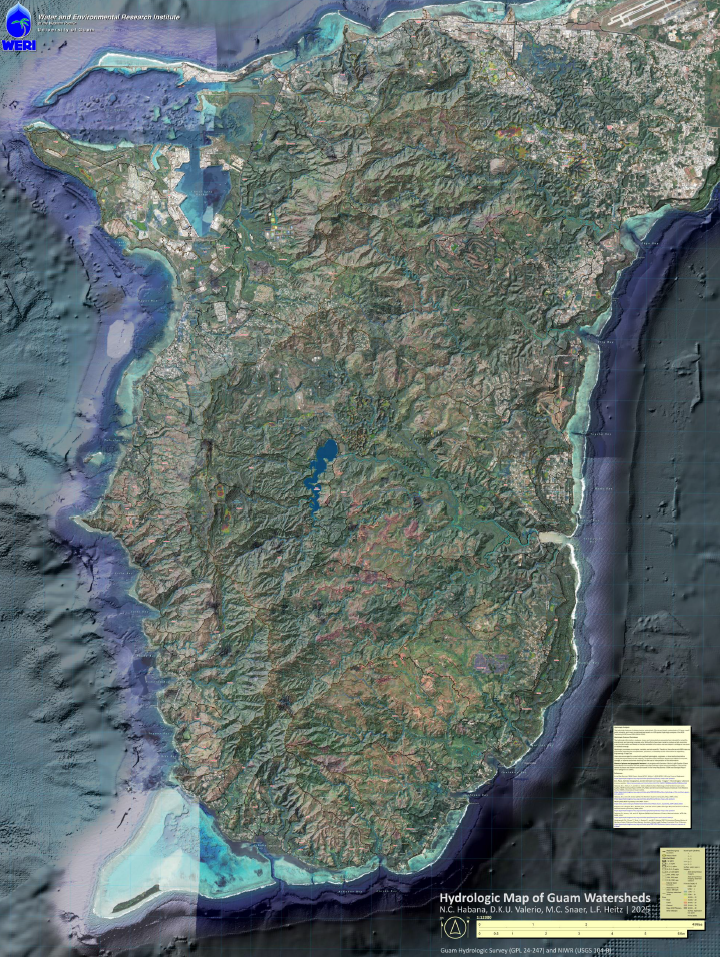
The map will continue to improve, now undergoing selection of place names, and proper naming/spelling of watersheds and geographic features through the Kumisión I Na’an Lugåt Guåhan (Commission of Place Names, Guam). A large map plate and accompanying technical report is in progress as well, and once complete may be distributed to stakeholders in the Watershed Planning Committee, Bureau of Statistics and Plans, the Guam Coastal Management Program, the Guam Environmental Protection Agency, and Department of Education. The Island have seen the recent uploaded hydrologic map product (10th Assembly of Planner’s Symposium, 2025) and have expressed great interest and are anticipating the map’s update with place names in 2026.
The current map results are in use with interagency partners. Another phase plan for surface hydrology is to repeat the process on the latest Guam DEM (2020) to combine north and south, into an extra-large map as the Surface hydrology of Guam.
GHS Research
WERI Researchers continue to observe and study the island’s water source. They focus on advancing hydrologic data-based research, going in depth into the components of Guam’s hydrologic cycle. This section covers the year’s research endeavors, organized along the componential lines of the hydrologic cycle and towards model development.
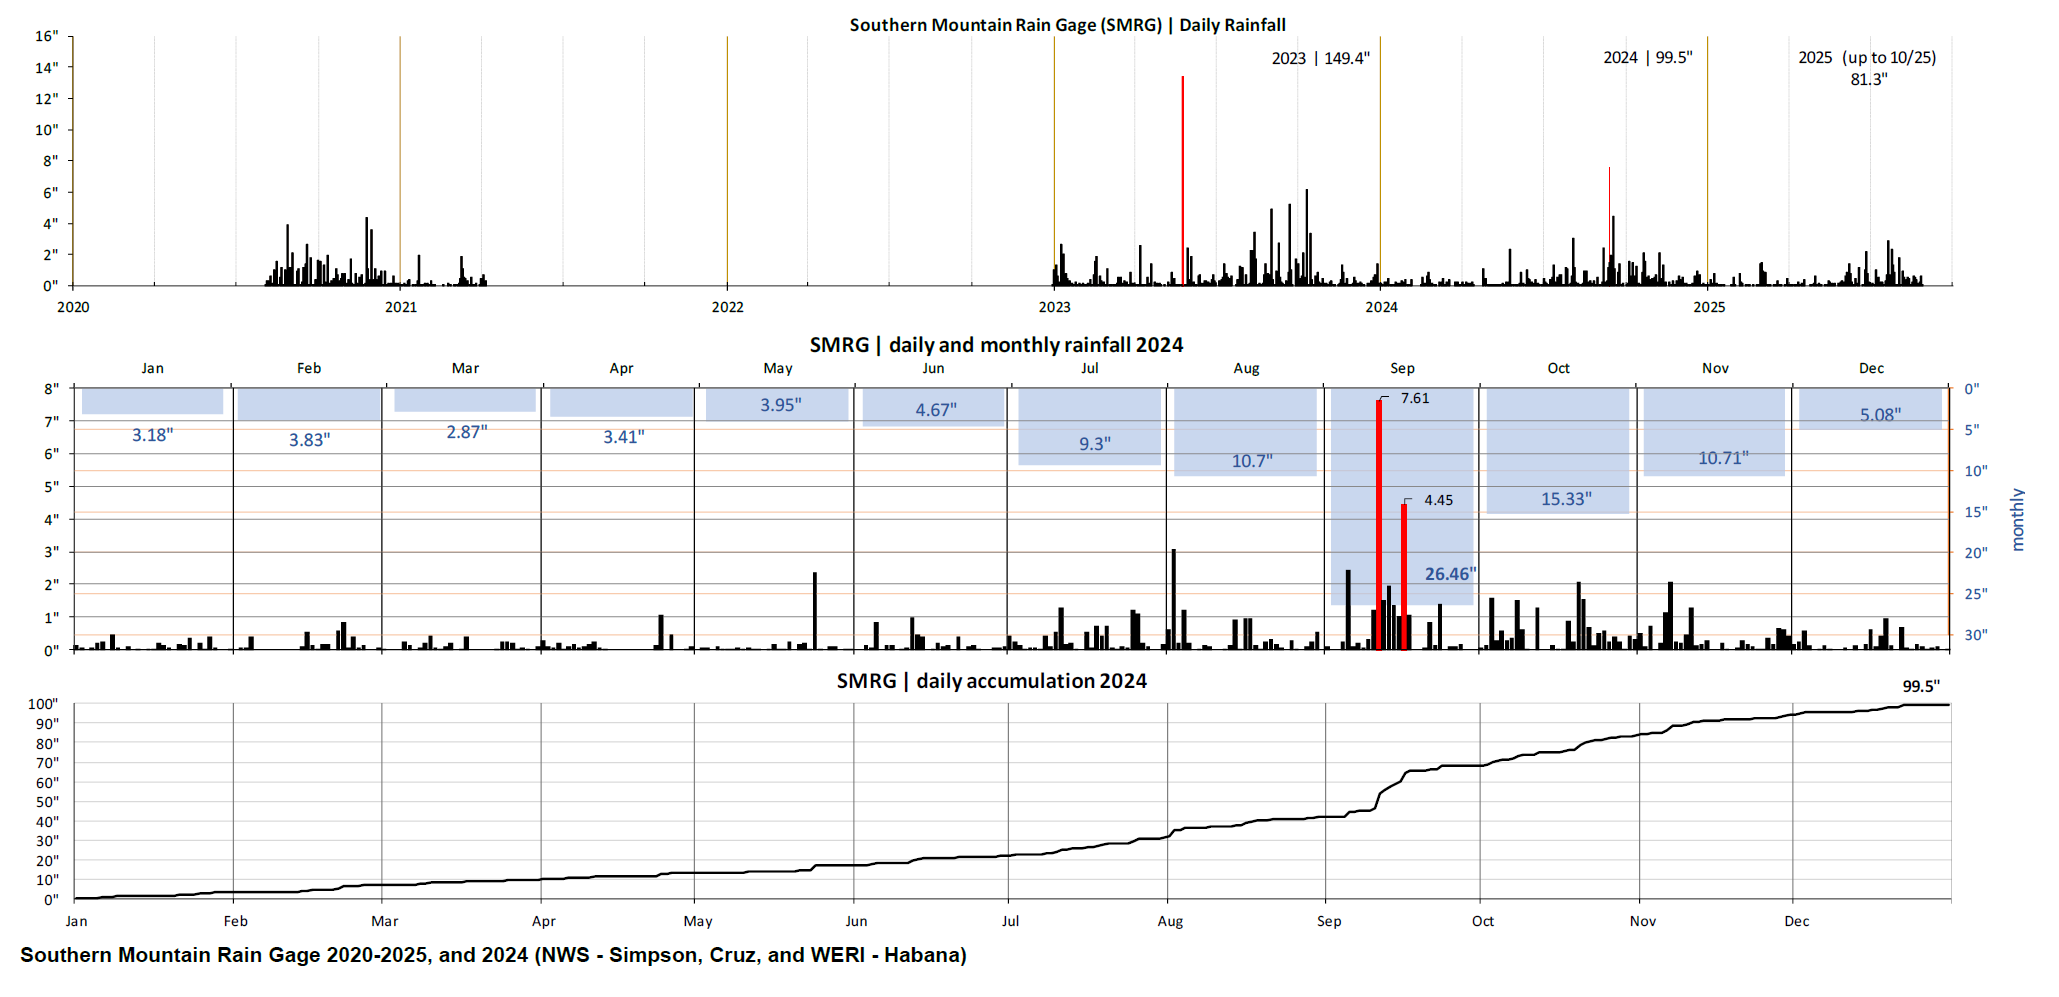
Climate and Weather
C. Simpson, I. Cruz, and N.C. Habana
NWS field team of Simpson and Cruz continue a monthly trek to the late Dr. Lander rain gage at the top of the Humåtac Watershed, called the Southern Mountain Rain Gage (SMRG). Habana processes the rain data for analysis. In 2023, the year of Typhoon Mawar, the SMRG logged more than 149 inches of rainfall, which may be one of the highest annual recorded rainfalls in Guam (see graph, next 2 pages). The following year had about a 100” of annual rainfall. In 2025, up to October 25, the SMRG total was 81 in. In 2024, the highest monthly rainfall recorded was 26.5 in, in September. That month had two daily rainfalls greater than 4 in (red bars).
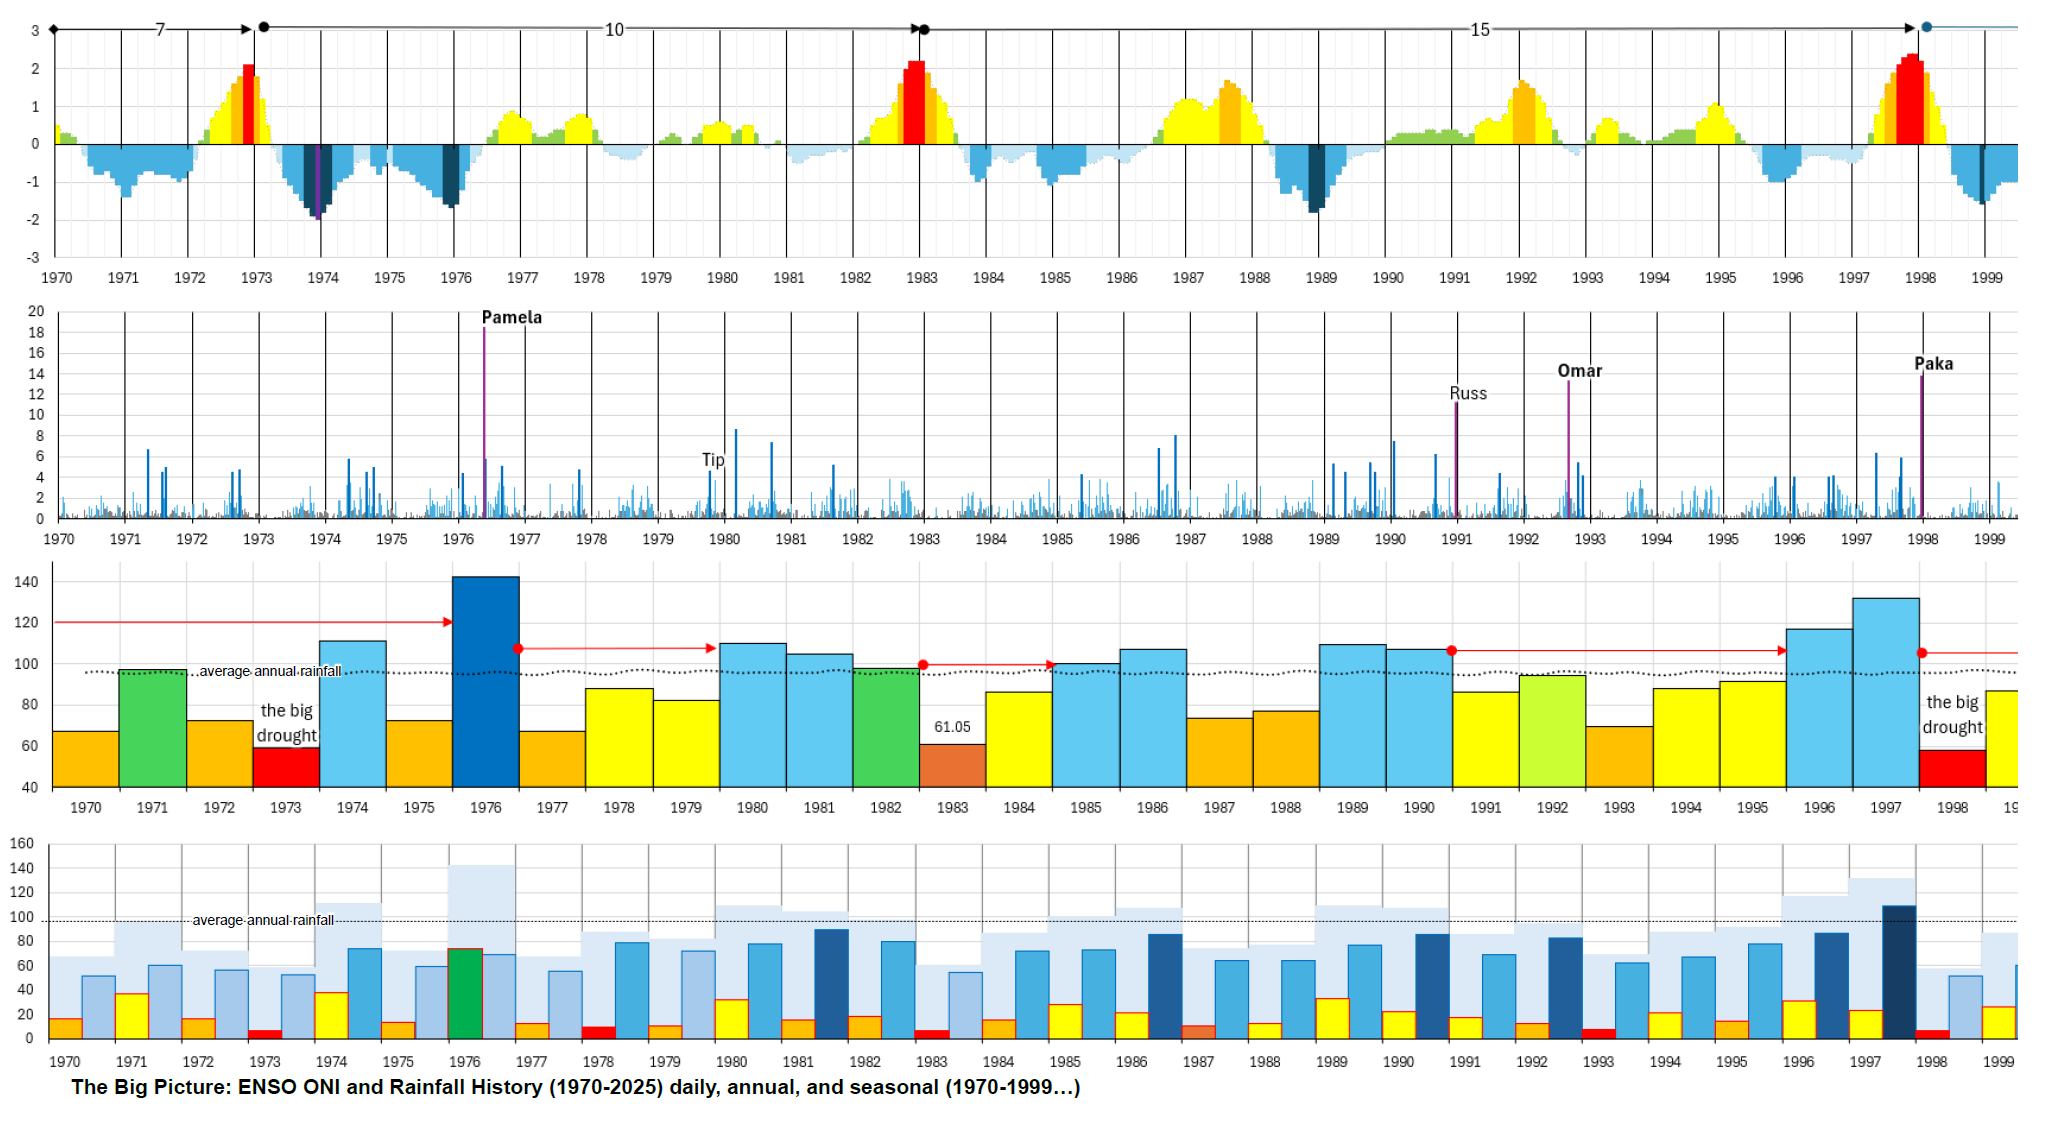
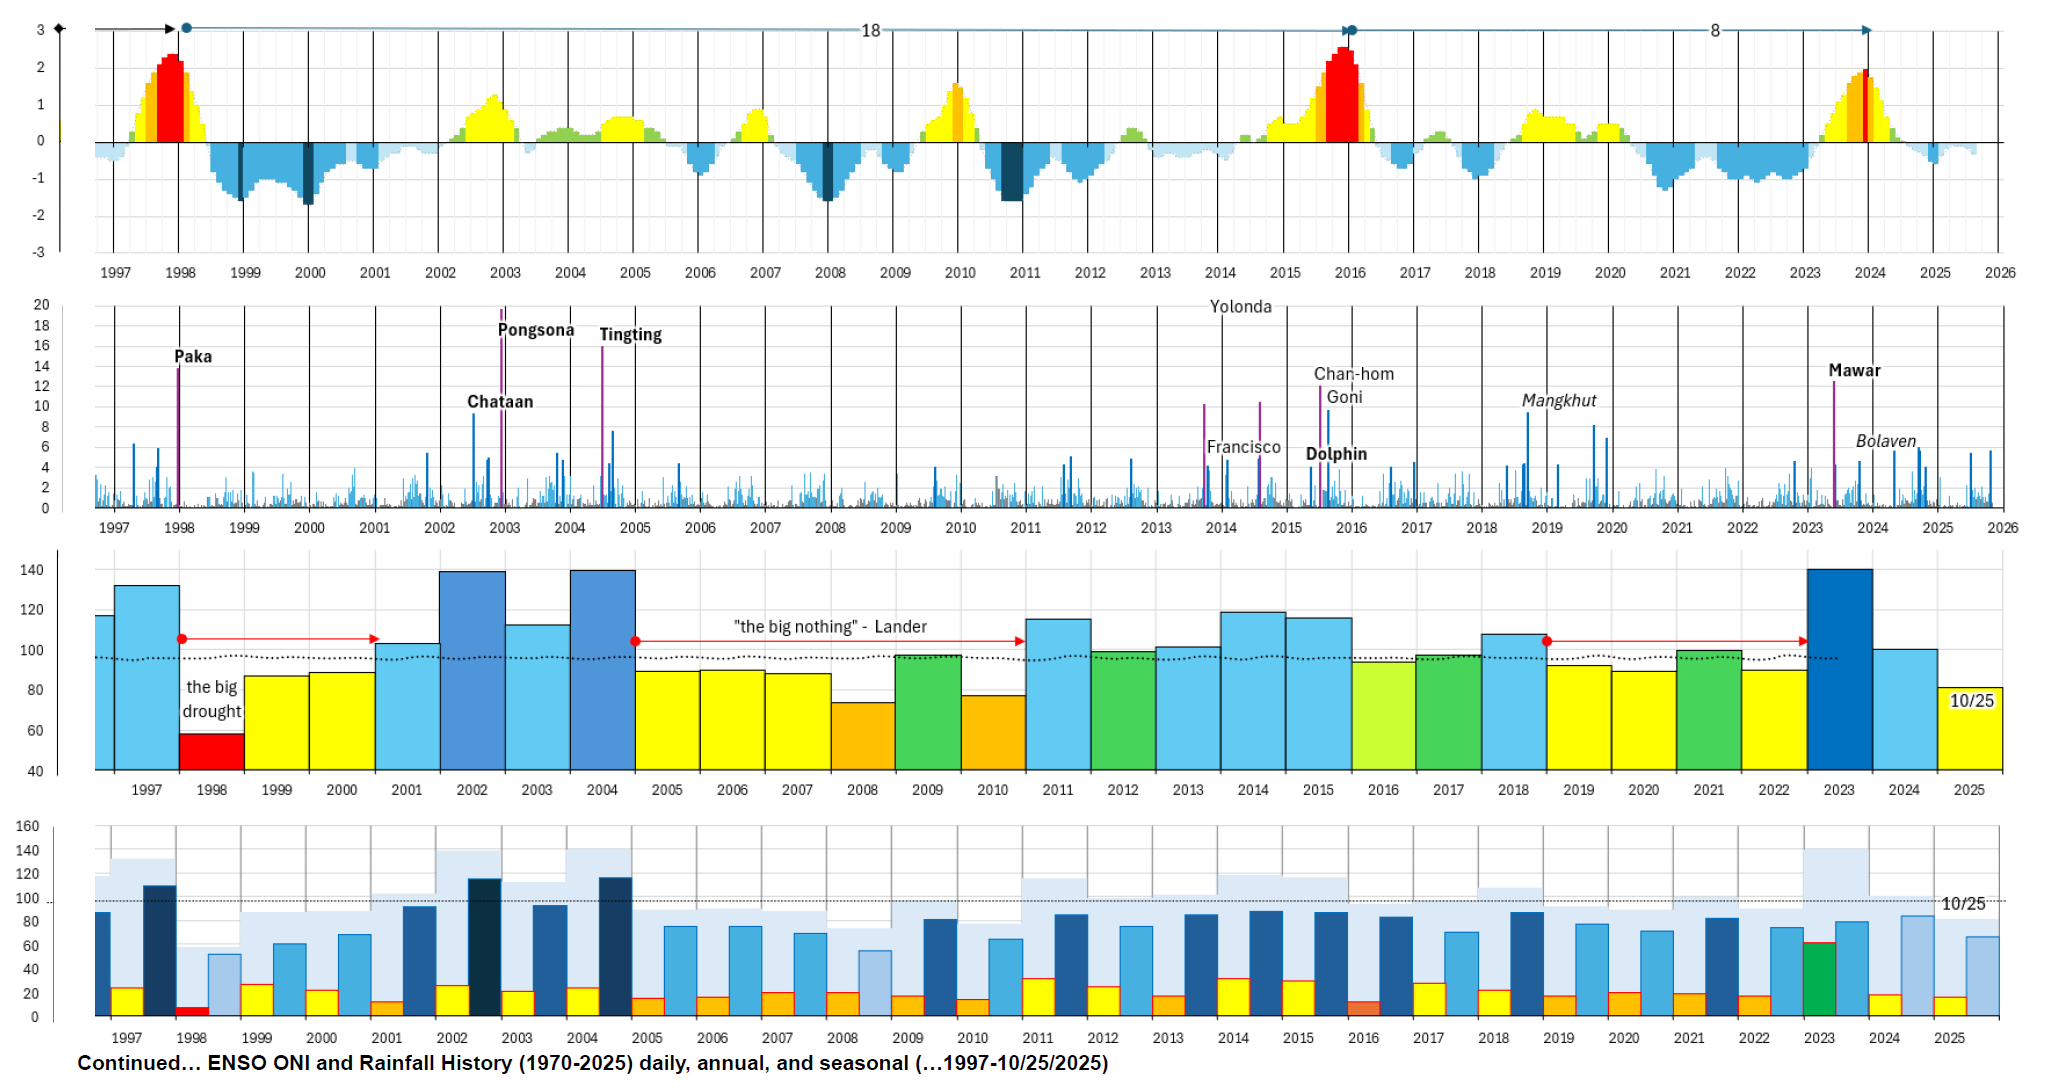
WERI GHS Program (Habana) compiles a multi-graph history of ENSO and rainfall, providing a valuable resource for hydrologic studies over 55 years. Spanning two large pages, the visualization covers the period from 1970 through October 10, 2025. The graph’s structure is organized by year, marked by major vertical gridlines, and further delineated into quarters by minor gridlines. The top panel plots the Oceanic Niño Index (ONI), sourced from the NOAA NWS Climate Prediction Center, illustrating positive (El Niño) and negative (La Niña) values.
ENSO strength is visually categorized using a clear color scheme:
- El Niño strengths: Weak [0.5, 1), Moderate [1, 1.5), Strong [1.5, 2), and Super (≥2) are colored in increasing intensities of yellow, orange, and red.
- La Niña strengths: Weak [-0.5, -1), Moderate [-1, -1.5), Strong [-1.5, -2), and Super (≤-2) use a progression of light to dark blue and purple.
- ENSO neutral is defined by ONI values between -0.5 and 0.5.
Below the ONI plot, three aligned panels illustrate rainfall data from the NAS rain gauge:
- Daily rainfall is depicted using bars colored by intensity, ranging from gray (0–1 inch) to purple (over 10 inches). Notable typhoons, such as Pamela (18.5 inches) and Pongsona (19.7 inches), are labeled next to their corresponding rainfall spikes.
- Annual rainfall is shown with a color-graded backdrop, indicating drought conditions (red, <60 inches) through periods of high rainfall (dark blue, >100 inches). Four years recorded near or above 140 inches, while significant droughts occurred in 1973 and 1998, with the latter leading to the CWMP and GHS legislation.
- Seasonal rainfall (dry: Jan–Jun; wet: Jul–Dec) is also color-coded using the ROYGB scheme.
Click on the image to enlarge:
Water Quantity and Quality
Water resource quantity may be limited by quality. In the Northern Guam Lens Aquifer, sustainable production can be influenced by both hydrology and quality. WERI studies both the quality and quantity of its water resources that may provide insight to improving its production capacity and contribute to advanced studies such as groundwater model development. The researched hydrologic information through the GHS and CWMP Program is centered on these studies.
Chloride and Production Study
Chloride and Production Study
H. Ko, Y. Wen, J. Jenson, D. Cabrera, G. Badowski, and N.C. Habana
Hazelle Ko, a graduate student in the Environmental Science Program at the University of Guam (UOG), supported by GHS Program, successfully defended her master’s thesis in November 2024. Her comprehensive research focused on 49 years of chloride trends within nine wells in the Yigo-Tumon Basin of the Northern Guam Lens Aquifer. By evaluating the impacts of natural factors like ENSO, rainfall, and sea level, alongside well production rates, she determined that increasing chloride concentrations were influenced by well pumping, design, and saltwater intrusion. Though more recent data suggests a potential reversal in trends, the overall long-term increase underscores the critical need for sustainable groundwater management.
Beyond her thesis, Ko’s contributions to environmental science at UOG have been significant. Before enrolling in the graduate program in 2022, she began her collaboration with Dr. Yuming Wen in 2021, focusing on the hydrological characteristics of the Finegayan Basin. She continued this work, including on a federally funded project concerning salinity trends in the Northern Guam Lens Aquifer. Her exceptional performance earned her UOG’s “Outstanding Graduate Award” in May 2023. Additionally, Ko has presented her work at several national and international conferences, receiving “Best Presentation” at the 14th International Conference on Environmental Science and Development in Xiamen, China. Her research provides vital insights into the sustainability of Guam’s primary water source. WERI UOG and the GHS Program graduates an outstanding environmental scientist.
Comparisons of Patterns and Trends of Salinity in Basins, NGLA
Comparisons of Patterns and Trends of Salinity in Basins, NGLA
H. Ko, N. Mathews, and Y. Wen
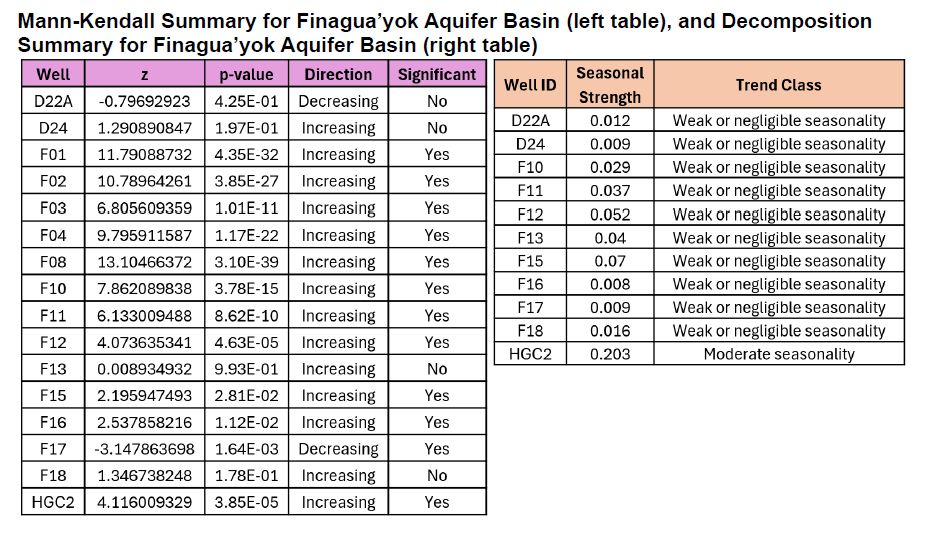
This project presents an updated assessment of chloride concentration trends and production patterns in the Finagua’yok, Tomhom, Hagåtña, and Mangilao Basins, building upon the findings of four previous technical reports. The primary objective is to provide a consistent, basin-scale evaluation of recent data, highlighting changes over the past decade and ongoing patterns in groundwater quality and well production. The analysis integrates updated decadal statistics, spatial mapping of chloride trends, updated statistical analysis (Mann-Kendall and STL decomposition), and evaluation of pumping practices relative to Northern Guam Lens Study (NGLS) recommendations. By comparing the most recent decade with the preceding decade, this research identifies wells that have maintained stable conditions as well as those indicating changes in chloride concentrations or production rates. Summary tables and maps are used to support these assessments, providing a clear view of temporal and spatial patterns that may inform water management decisions. The Mann-Kendall and STL Decomposition results for Finagua’yok Basin are shown in Tables 1 and 2. The updated evaluation is intended to serve as a reference for ongoing monitoring, management planning, and decision-making in the Northern Guam Lens Aquifer, complementing the prior reports while emphasizing recent trends and emerging areas of concern.
Water Quality Monitoring of Agana Swamp on Guam
Water Quality Monitoring of Agana Swamp on Guam
Y. Kim, I. Snively, and A. Ludwig
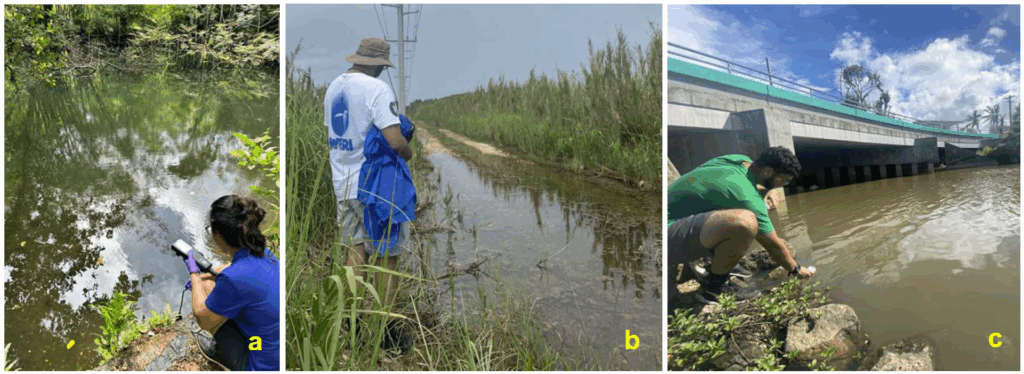
Agana Swamp, located near the village of Hagåtña, provides important ecological functions by intercepting runoff and storing or transforming potential pollutants. However, elevated contaminant levels can adversely affect both benthic organisms and overall water quality. In this study, we selected three monitoring sites: (a) Agana Spring — the source of the Agana River, (b) Agana Swamp — located in the middle of the wetland, and (c) the downstream section of the Agana River. Agana Spring, which originates from groundwater, flows toward Agana Swamp; thus, its water quality data provide insight into how conditions change as water flows downstream. The Agana River originates from Agana Spring and passes through Agana Swamp, so sampling downstream of the river helps assess variations in water quality within the swamp. Over a one-month period, we monitored temperature, pH, dissolved oxygen, total nitrogen, total phosphorus, nitrate, nitrite, ammonia, orthophosphate, total dissolved solids, and conductivity. In Agana Swamp, nitrate/nitrite–nitrogen levels were below the detection limit (<0.010 mg/L-N), indicating that the swamp plays a role in reducing water pollutants. Chloride concentrations in Agana Spring water ranged from 80 to 190 mg/L, which were relatively higher than those in Agana River water collected at the Agana Bridge near the ocean.
Contaminants – PFAS and Dieldrin
Contaminants – PFAS and Dieldrin
Other than chloride (saltwater) that can limit or even terminate/halt utility water production, Per- and polyflouroalkyl substances (PFAS) and Dieldrin are now in the headlines for contaminants of concern (PDN, GDP). PFAS is manufactured mainly for its special properties that the chemical is both hydrophobic and oleophobic – repels water and oil. PFAS is a health concern as the chemicals are found to accumulate in the body. In a WERI study, a form of PFAS was found present in every site tested (Duenas et al. 2023). USEPA data for Guam maps the PFAS in production wells. Dieldrin on the other hand is a banned pesticide (1987) and is classified as a probable human carcinogen, according to USEPA. Guam EPA provides a map of production wells with levels of Dieldrin for notification and response (next two pages).
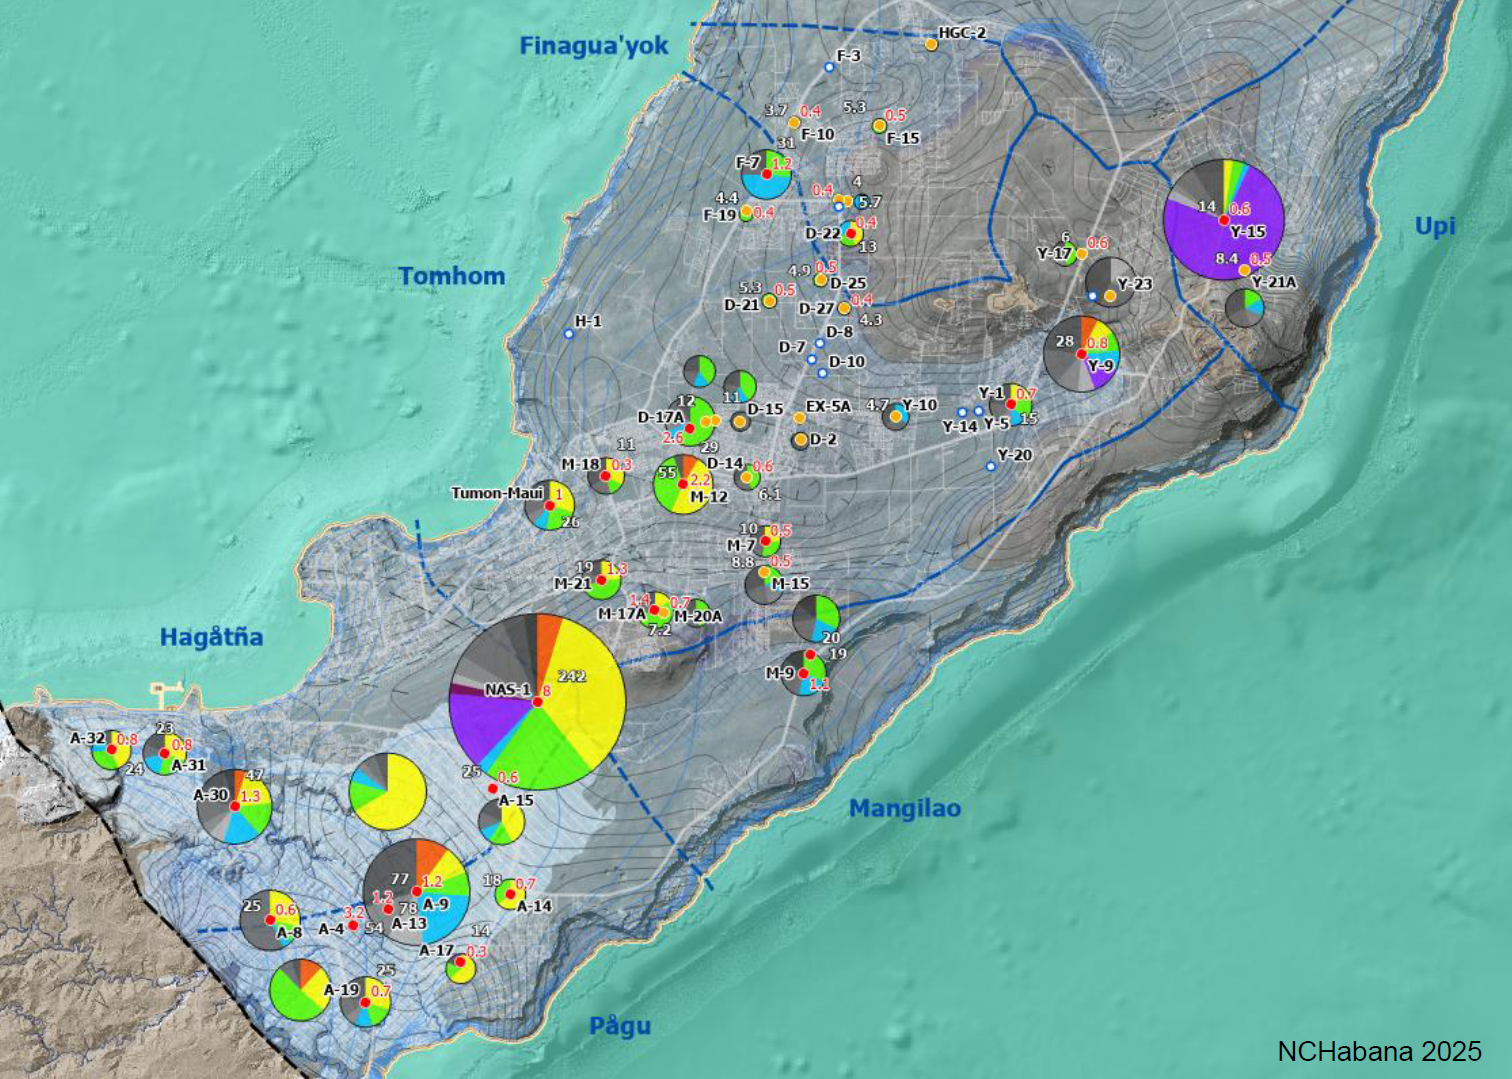
Production wells and PFAS (USEPA UCMR5).
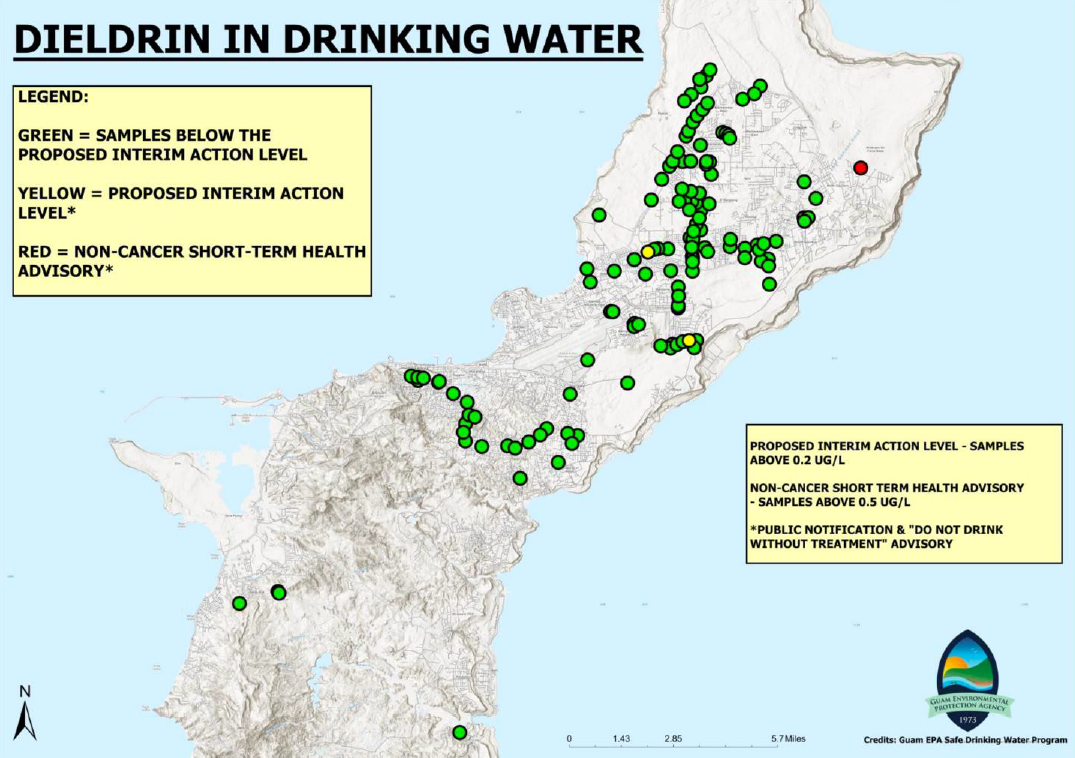
GEPA production wells and dieldrin map (GEPA 2024)
Hydrology, Hydrogeology, and
Groundwater Protection Zone
Two projects focus on managing the Northern Guam Lens Aquifer (NGLA). One uses a GIS-based model with the DRASTIC index to update Groundwater Protection Zones, assessing aquifer vulnerability to human activities. The other analyzes long-term Deep Observation Well data to understand how rainfall and other factors impact the freshwater lens’ thickness.
Establishing a GIS-based Model for Updating Groundwater Protection Zones in Guam
Establishing a GIS-based Model for Updating Groundwater Protection Zones in Guam
R. Uludong and Y. Wen
The research is conducted to update Guam’s Groundwater Protection Zone (GPZ) by assessing the aquifer’s groundwater protection zone (GPZ) and establishing a GIS-based Model to update the GPZ. The islands aquifer, also known as Northern Guam Lens Aquifer (NGLA) is comprised of nearly half of the Islands geography. Most of the island’s anthropogenic activities, infrastructures, waste and wastewater transmission are situated atop of the aquifer. There are ongoing and continuations of anthropogenic activities (developments) that are drawing concerns to aquifer vulnerability. With advanced geospatial technologies it is possible to assess and evaluate the vulnerability of GPZ so that the sustainability of the island’s water resources and ecosystem can be addressed. The use of the DRASTIC index method while incorporated with GIS can be applied to evaluate the GPZ’s vulnerabilities. The project focuses on hydrogeologic settings, while implementing the calculation of weights and ratings for the DRASTIC parameters. The data for the seven parameters of DRASTIC Depth to water table, net Recharge, Aquifer media, Soil media, Topography (Slope), Impact to the vadose zone, and hydraulic Conductivity need to be collected and processed so that they can be incorporated into the DRTASTIC model for calculation of the DRASTIC index to evaluate the vulnerabilities for GPZ in ArcGIS. This project will provide a visual result level of areas of susceptibility to groundwater contamination in the NGLA. The final DRASTIC Index (DI) is a weighted linear combination of the model’s parameters and is calculated using the following equation:
DI = DrDw + RrRw + ArAw + SrSw + TrTw + IrIw + CrCw
where D, R, A, S, T, I and C stand for the parameters while w and r represent the weight of each parameter and the corresponding rating, respectively.
Deep Observation Wells
Deep Observation Wells
M.C. Snaer, N.C. Habana, Y. Kim, and L. Aquino
Deep Observation Wells (DOWs) are vertical ports used to obtain detailed salinity profiles of the phreatic zone within the Northern Guam Lens Aquifer (NGLA), which contains a freshwater lens supplying about 90% (42 of 45 MGD) of Guam’s utility water. The bottom of NGLA’s freshwater lens has a transition zone that grades with depth from brackish, to saline, and saltwater.
Eight DOWs distributed across northern Guam, each with over twenty years of data, extend into the saltwater portion of the phreatic zone. Conductivity, temperature, and depth (CTD) transducers are lowered into the DOWs semi-annually to collect long-term records of water levels, freshwater lens thickness, transition zone fluctuations, and saltwater interface position. These historic datasets reveal changes in conductivity(salinity), lens position, and thickness that reflect both climatic and hydrologic variations over time.
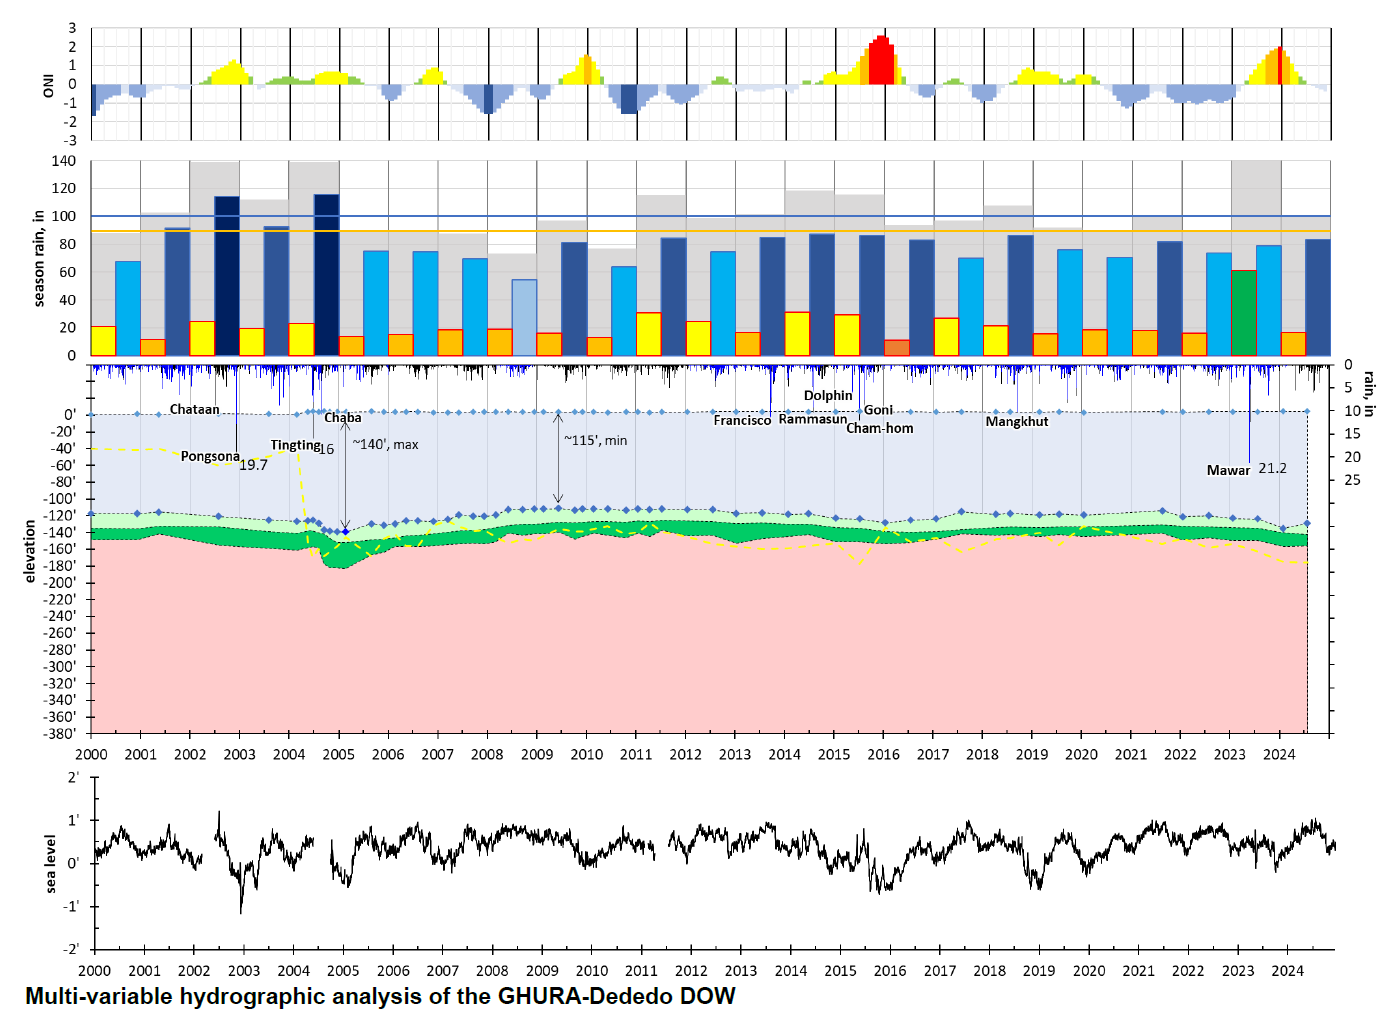
This study analyzes how rainfall, tides, and climate phenomena such as El Niño and La Niña influence freshwater lens thickness. Multi-variable hydrographic analyses integrate the Oceanic Niño Index (ONI), rainfall, sea level, and DOW historic salinity profile data to illustrate the aquifer’s response to climatic and hydrologic conditions. At the GHURA-Dededo DOW, for example, lens thickness fluctuates with drought and recharge periods, including major typhoon rainfall events such as Pongsona (2002), Dolphin (2015), Mangkhut (2018), and Mawar (2023).
These long-term observations are essential for evaluating aquifer resilience to drought and recharge efficiency across different areas within the aquifer. They also help refine groundwater model parameters, improve understanding of freshwater lens dynamics, and support the sustainable management and development of Guam’s water resources.
Groundwater Modeling
All the studies mentioned above are key components for ultimately developing a useful model of the island’s sole source aquifer. Research provides important hydrologic and statistical information that is key to building a reliable model. Groundwater models can run an acceptable representation on a computer, simulating and testing scenarios for optimum development. Hydrologic models have limitations vs reality; however, they provide insight into capacities and vulnerabilities, and may help with determining sustainable development and water resources management strategies, including enacting appropriate regulations/laws for protecting the aquifer.
Nitrate-N Solute Transport of the Tomhom Aquifer Basin
Nitrate-N Solute Transport of the Tomhom Aquifer Basin
A. Bautista, J.A. Caasi, T. Wood, and N.C. Habana
This study builds upon the Swamp Road pilot model by applying a similar modeling approach to the Tomhom Aquifer Basin, the most productive groundwater basin within the NGLA. The model was constructed using Esri ArcGIS Pro and Aquaveo GMS, MODFLOW USG, which provided the framework for compiling and refining spatial datasets, as well as simulating groundwater flow and solute transport. Three scenarios were formulated to represent different conditions, including on/off pumping and varying nitrate-nitrogen inputs, to evaluate nitrate migration toward production wells. Among the model simulations, one scenario identified nitrate hotspots in areas containing existing septic tank systems, suggesting potential plume migration toward nearby production wells. These findings emphasize the importance of proper wastewater management and land-use planning to protect the quality of Guam’s primary drinking water resource. This research was presented at the 2025 WERI–GLE Guam Hydrologic Survey (GHS) Workshop, and a technical report will be produced to further document and analyze the results of this study.
Nitrate- N Solute Transport of Swamp Road
Nitrate- N Solute Transport of Swamp Road
A. Bautista, J.A. Caasi, T. Wood, and N.C. Habana
The freshwater source in the NGLA is vulnerable to the island’s wastewater system. Ongoing urban growth, aging established residential areas, and wastewater discharge above the water source via septic tanks and leaky/overflowed sewer mains have long posed risks to groundwater quality. Nitrate analyses of production wells have found many wells with an increased trend in nitrate-N concentrations (The Guam Daily Post 2020). This study applied a solute transport model in the Swamp Road area to evaluate current regulations governing residential septic tank density and distances between buildings to production wells. The model results revealed the extent of contaminant plumes near production wells, which may support refined regulations for development near production wells. This research continues to make model refinements of nitrate-N sources and scenarios in a planned residential area near the Swamp Road production wells. The model examined septic tank use within a planned high-density residential area, revealing intensified nitrate plume formation. Findings from this study have been presented to various island agencies and at multiple venues, gaining significant attention from the Guam Legislature. It serves as a pilot study for future research on groundwater contaminant transport across the island. A technical report detailing the study’s findings and implications is expected to be completed by the end of the year.
Groundwater Model of the Tomhom Aquifer
Groundwater Model of the Tomhom Aquifer
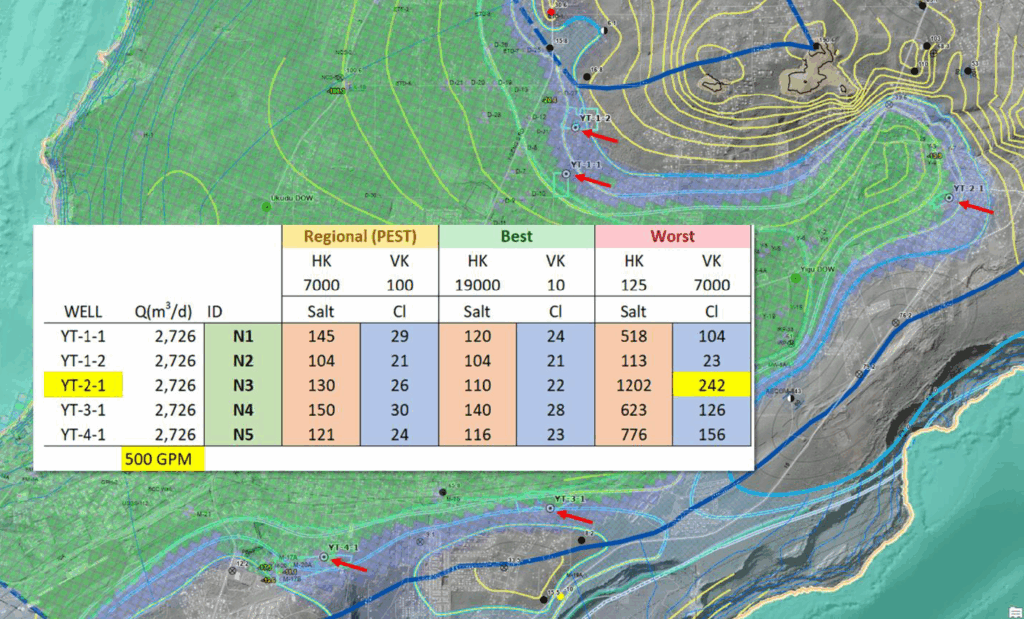
J.A. Caasi, N.C. Habana, B. Railey, T. Wood, and H. Tran
WERI GHS groundwater model research team and Aquaveo® GMS produced a SEAWAT phreatic model of the Tomhom Aquifer, NGLA. The Tomhom Aquifer supplies nearly 20 MGD, about half of the total utility water from the NGLA. The model was created to test a GWA Master Plan, well relocation option, which terminates and moves the poor performing production wells to the aquifer “sweet spot,” also known as the parabasal zone. Production wells in the parabasal zone are less susceptible to saltwater intrusion (McDonald 2003, WTR 98), and may allow increased production rate. The poor performing production wells are low pump rate that is limited by chloride (saltwater) updraw. Five wells were chosen, based on GWA production well chloride and pump rate data. And five relocation sites in the parabasal zone were selected. The model was “calibrated,” local hydraulic conductivity (vertical and horizontal) was adjusted to match the well chloride concentration, using the latest pump rate for each well. Then, the existing parabasal wells were analyzed with the model hydraulic conductivities, in search for the hydraulic conductivities of its worst and best performing wells in the zone. The regional hydraulic conductivities were included in the test as well. Pumping each relocated well at 500 gpm, model results showed that in each case of hydraulic conductivities, the chloride concentration was below 250 mg/L in each well. A technical report needs to be produced for this GHS research work.
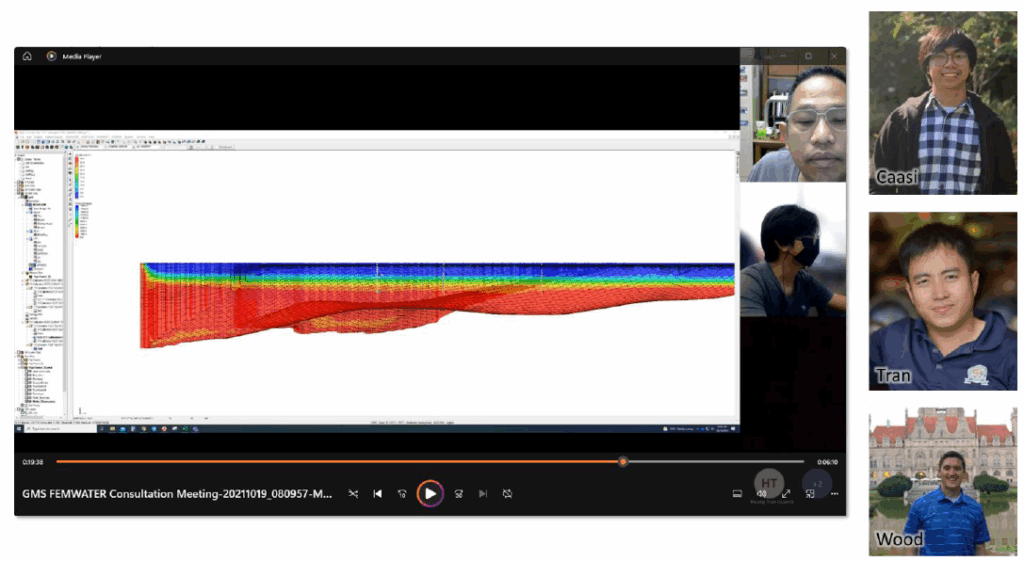
WERI and Aquaveo, 3-D SEAWAT phreatic model of the Tomhom Aquifer, showing the freshwater lens (dark blue), transition zone (green-yellow), and saltwater (red)
GHS Outreach:
Presentations, Tours, Workshops,
Conferences, Symposiums, and Meetings
WERI includes education and outreach programs to government and private sector employees and stakeholders, and to educators as well. In this fiscal year, WERI and Global Learning and Engagement (GLE, UOG) brought back the Northern Guam Lens Aquifer Tour and The GHS WERI Workshop, including educational outreach activities through an international collaboration workshop and special days for our public-school students. WERI also presented their GHS research work and products in the local and national stage. The full news/events story are available on the WERI website. The WERI Guam Hydrologic Survey Program continues to make local and national impact.
Aquifer Tour, Workshop, and Educational Outreach
The following are WERI GHS outreach stages where WERI shared their works in tours and workshop and educational outreach to our public-school students. The following are links to the events/news and full story on the WERI website:
- 2025 – WERI International Collaborative Research Workshop with Changwon National University’s (CWNU) Global Learning and Academic Research Institute for Master’s, PhD students and Postdocs (GLAMP)
- 2025 – Career Day – J.Q. San Miguel Elementary School
- 2025 – Guam Rocks! (Ritidian’s National Wildlife Refuge)
- 2025 – WERI’s Northern Guam Lens Aquifer Tour
- 2025 – WERI-GLE GHS Workshop
The WERI-GLE GHS Workshop is the GHS Outreach Program’s along the Guam Advisory Council Meeting is one of the most sought-after outreach the island stakeholders in government, military, and private sectors look forward to attending. This year’s workshop was attended by 14 important stakeholder-agencies on the island.
Workshop Attendees:
- Bureau of Statistics and Plans, Guam Coastal Management Program
- Department of Land Management
- Guam Department of Agriculture
- Guam Environmental Protection Agency
- Gutteridge Haskins & Davey Inc.
- Guam Housing and Urban Renewal Authority
- Guam Waterworks Authority
- HDR, Inc.
- Guam Legislature (Senator Perez’s Office)
- Naval Facilities Engineering Systems Command Marianas
- Northern and Southern Guam Soil and Water Conservation District
- National Weather Service, Weather Forecast Office
- University of Guam: SENG, CLASS/DEAL, CNAS, WERI
- US Geological Survey, Pacific Islands Water Science Center
Workshop presentations that were presented and submitted are now available on the GHS website’s Presentation Library.
Conference/Symposium/Meeting Presentations
Into FY 2025, the following were outreach stages where GHS projects and products were presented in a Conference/Stakeholder’s Meeting. The following are links to the events/news on the WERI website:
- 2024 WERI CNMI Advisory Council Meeting
- 2024 WERI Guam Advisory Council Meeting
- 2024 National Groundwater Association (NGWA), Annual Groundwater Week (Snaer awarded the Farvolden Scholarship)
- 2025 Watershed Planning Committee Meeting
- 2025 Southern Guam Soil and Water Conservation District – Guam Educators Conservation Summit
- 2025 University of Guam’s Conference on Island Sustainability
- 2025 UCOWR/NIWR Annual Water Resources Conference, University of Minnesota
- 2025 Watershed Planning Committee Meeting
- 2025 Northern Guam Soil and Water Conservation District – Educator’s Symposium
- 2025 10th Assembly of Planners Symposium
- 2025 Worldwide Meteorological Organization/United Nations Economic and Social Commissions for Asia and the Pacific’s (WMO/UNESCAP) Typhoon Committee Conference
Local News
Following news headlines during FY 2025 concerning the presence of PFAS and Dieldrin in Guam’s utility water, WERI took an active role in public engagement. WERI faculty provided numerous presentations and disseminated information to address community issues and concerns related to the contaminants. The contamination received coverage in multiple news outlets, including the Guam Daily Post and the Guam Pacific Daily News, prompting WERI to provide expert commentary and clarification.
- 2025 Dieldrin: Guam Daily Post | WERI News
- 2025 PFAS: Guam PDN Instagram | Guam Daily Post | WERI News
Comprehensive Water
Monitoring Program Activities
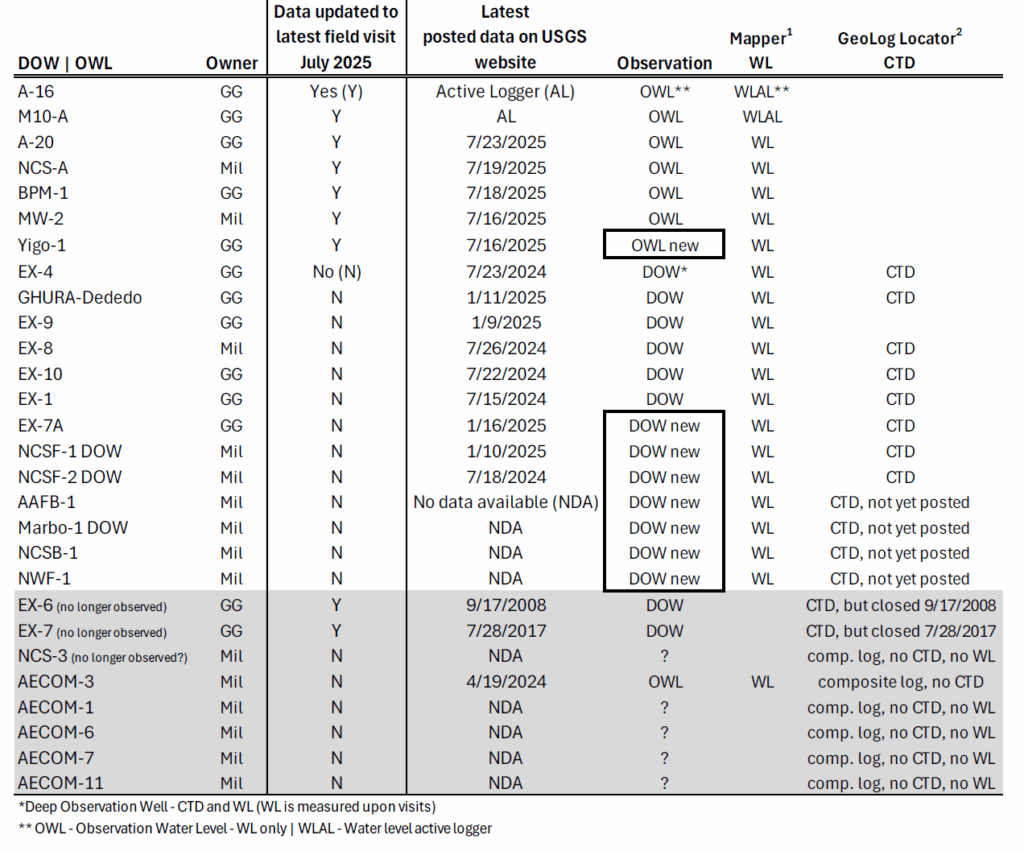
USGS-PIWSC continues hydrologic data collection under the CWMP. New DOWs have been constructed to improve phreatic modeling, historic profile assessments, and understanding of freshwater availability. However, the addition of new wells increases gaging and sampling, requiring additional operational and logistical support. In accordance with Public Law 24-247, the Government of Guam funds 50% of the CWMP cost share with USGS-PIWSC. This fiscal year, USGS-PIWSC completed four field visits to Guam. The most recently approved and published data are current through January 2025.
USGS-WERI Observation Well Data Collection
CWMP data collection was conducted in FY 2025. Due to the Federal Government shutdown, USGS PIWSC field team and administration are currently on furlough, thus USGS’ CWMP activities summary cannot be provided at this time.
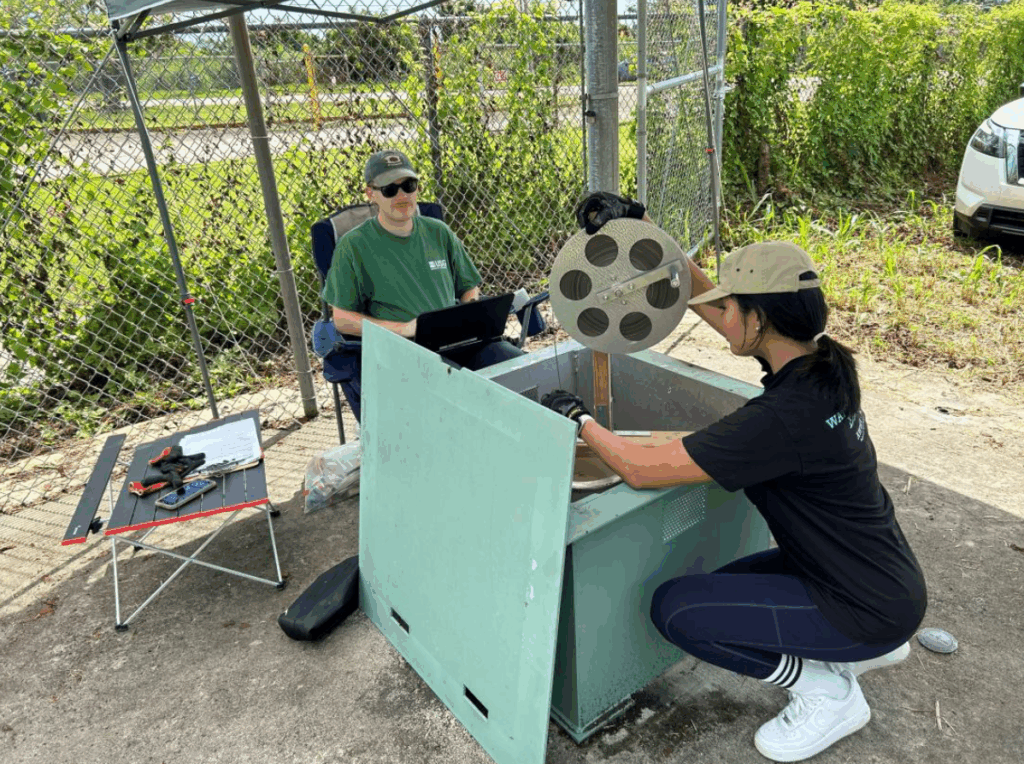
The USGS field team conducted hydrologic measurements and retrieved logger data during the following periods:
October 21–30, 2024 – All observation wells
January 4–18, 2025 – CTD measurements, all observation wells
April 13–22, 2025 – All observation wells
July 10–27, 2025 – CTD measurements, all observation wells
CTD measurements are scheduled semi-annual, in months of January and July.
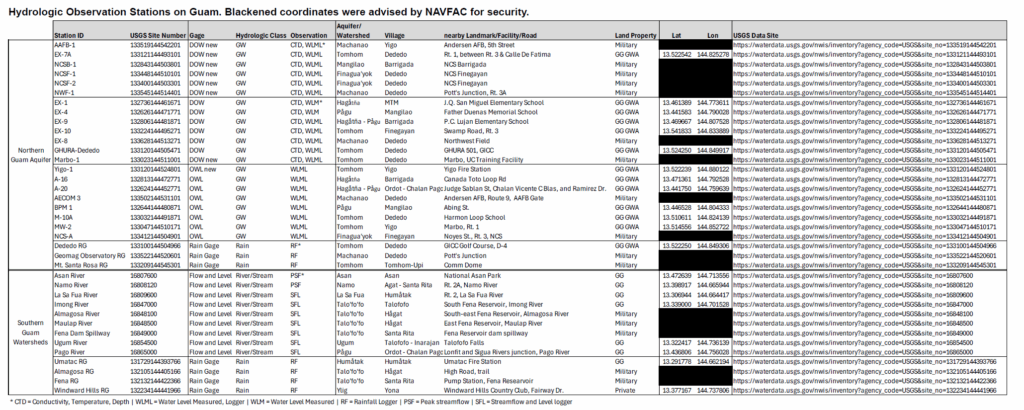
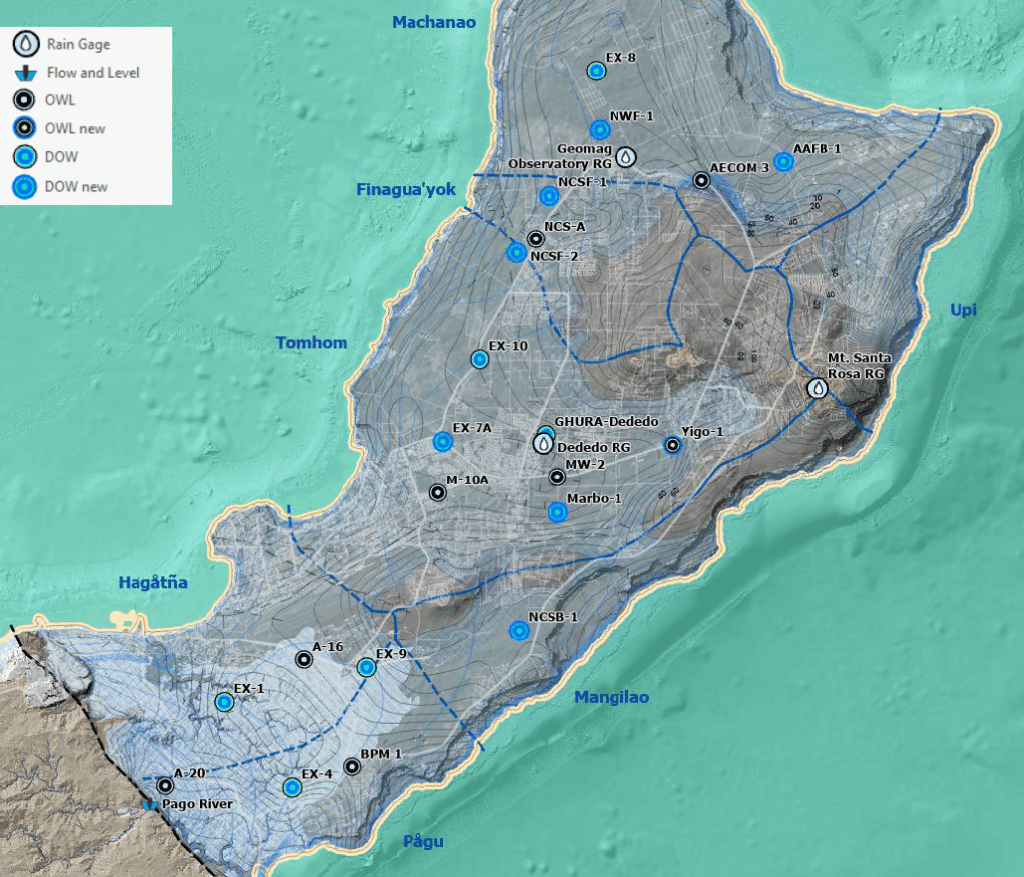
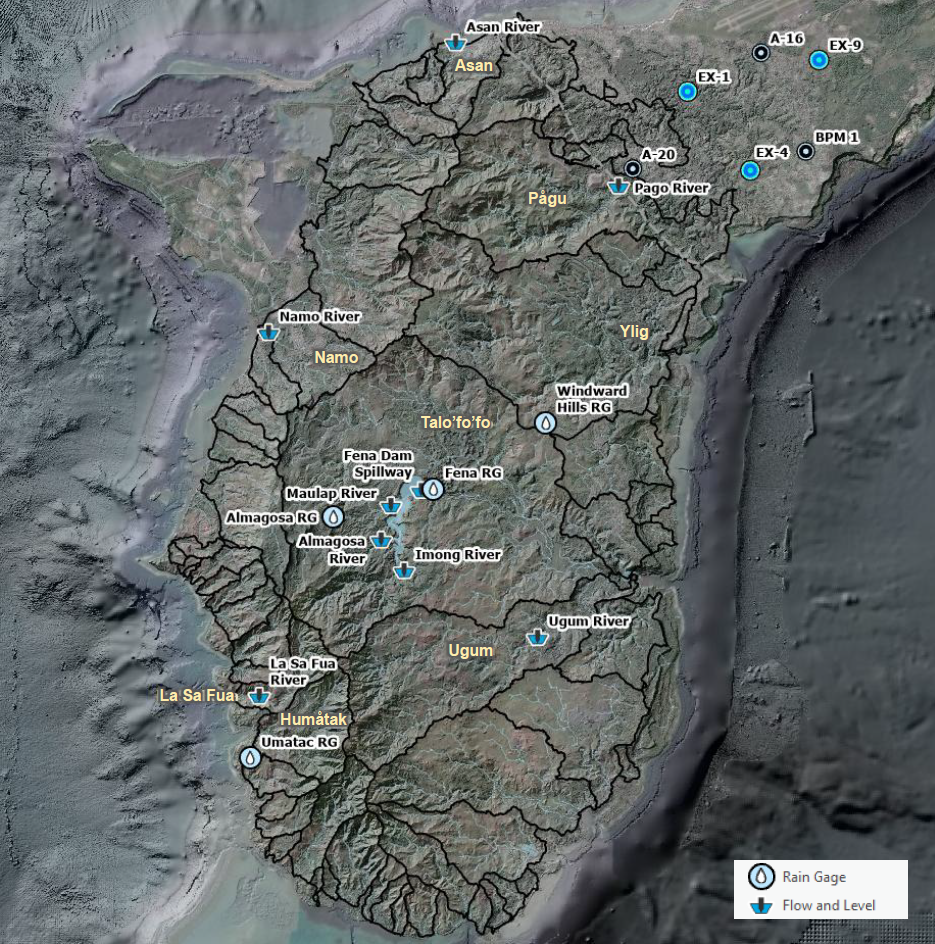
USGS operates 37 hydrologic gaging sites—24 within the aquifer and 13 within watersheds. A table lists these gaging stations alongside corresponding maps of the aquifer and watershed areas, with a link to the USGS online Mapper (see next four pages).
GHS-funded WERI Research Assistant and UOG Environmental Science graduate student Mary Clare Snaer joined the USGS field team for most DOW site visits. Snaer is conducting a hydrologic analysis of the phreatic zone (see Deep Observation Wells section above).
Pertinent Hydrologic Data
Building on existing collaboration, GWA provides WERI with monthly chloride and production data, which has been instrumental in developing MAppFx data visualization products and advancing research on groundwater flow, salinity, and nitrate transport. To produce a more robust and comprehensive annual aquifer report, a formal data-sharing protocol is needed. The protocol would ensure continuous and timely submission (at least quarterly) of observation well CTD, water level, and other regulated species data from all major agencies, including GWA, GEPA, and the military. Addressing and overcoming the challenges of acquiring sensitive utility information, often hindered by public water quality concerns, is a priority. By formalizing data submission, agencies can improve transparency, build public trust, and ensure that pertinent hydrologic data is consistently available for analysis, ultimately strengthening Guam’s water protection strategies.
Past Reports
| Title | Year | Authors | |
|---|---|---|---|
| View PDF | GHS and CWMP Annual Report FY 2025 | 2025 | N.C. Habana, D.K.U. Valerio, M.C. Snaer, A. Bautista, R. Miller, and H. Hettiarachchi |
| View PDF | GHS and CWMP Annual Report FY 2024 | 2024 | N. C. Habana, D. K. U. Valerio, and Y. Wen |
| View PDF | GHS and CWMP Annual Report FY 2023 | 2023 | N. C. Habana, M. C. Snaer, B. Miklavic, and R. Miller |
| View PDF | GHS and CWMP Annual Report FY 2022 | 2022 | J. W. Jenson, A. Agustin |
| View PDF | GHS and CWMP Annual Report FY 2021 | 2021 | J. W. Jenson, K. K. Bautista |
| View PDF | GHS and CWMP Annual Report FY 2019 | 2019 | N. C. Habana, Y. S. Kim, K. K. Bautista, and J. W. Jenson |
| View PDF | GHS and CWMP Annual Report FY 2018 | 2018 | N. C. Habana, Y. S. Kim, K. K. Bautista, and J. W. Jenson |
| View PDF | GHS and CWMP Annual Report FY 2017 | 2017 | N. C. Habana, Y. S. Kim, K. K. Bautista, and J. W. Jenson |


