The State of the Aquifer Report provides an assessment of the condition of the Northern Guam Lens Aquifer (NGLA). The report uses available groundwater quality and hydrologic data to identify concerns related to the quality and quantity of Guam’s aquifer.
1 Water Quality
Water quality is important to the NGLA. Continued development and activities above the aquifer can introduce contaminants into the freshwater lens and affect its quality. Maintaining quality while meeting drinking water standards is crucial to ensure a safe water supply for the island. Contaminants include dieldrin, per- and polyfluoroalkyl substances (PFAS), nitrates, and chloride.
1.1 Dieldrin
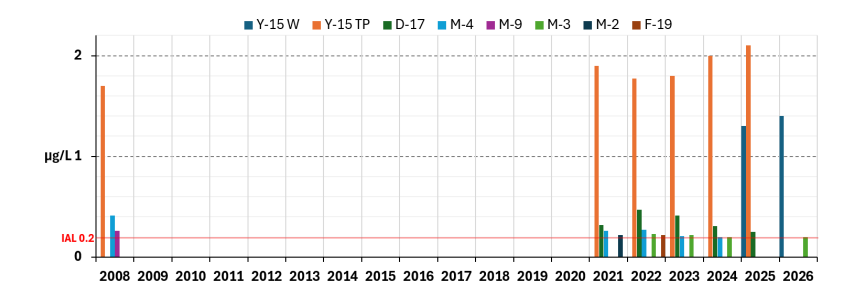
Dieldrin is a synthetic insecticide used in the 1950s to control agricultural pests. U.S. EPA banned most uses of dieldrin in 1974, although their use for termite control remained permitted until 1987. Dieldrin is highly persistent in the environment and exposure may pose health risks. Guam EPA established an Interim Action Level (IAL) of 0.20 µg/L (ppb) for dieldrin, which took effect on August 1, 2025. Information on the historical use of dieldrin in Guam is limited; however, monitoring data shown in Figure 1.1 indicate that dieldrin was detected in groundwater as early as 2008, with concentrations in production wells Y-15 and M-4 exceeding the current IAL.
Figure 1.1 Dieldrin monitoring data for select production wells, 2008 – 2026. Red line is Guam EPA’s IAL
of 0.20 µg/L.
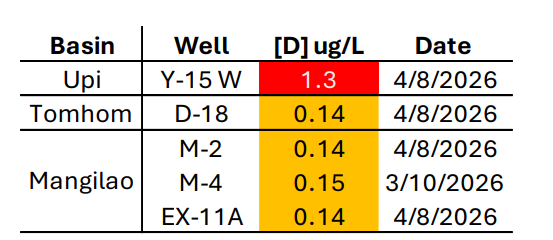
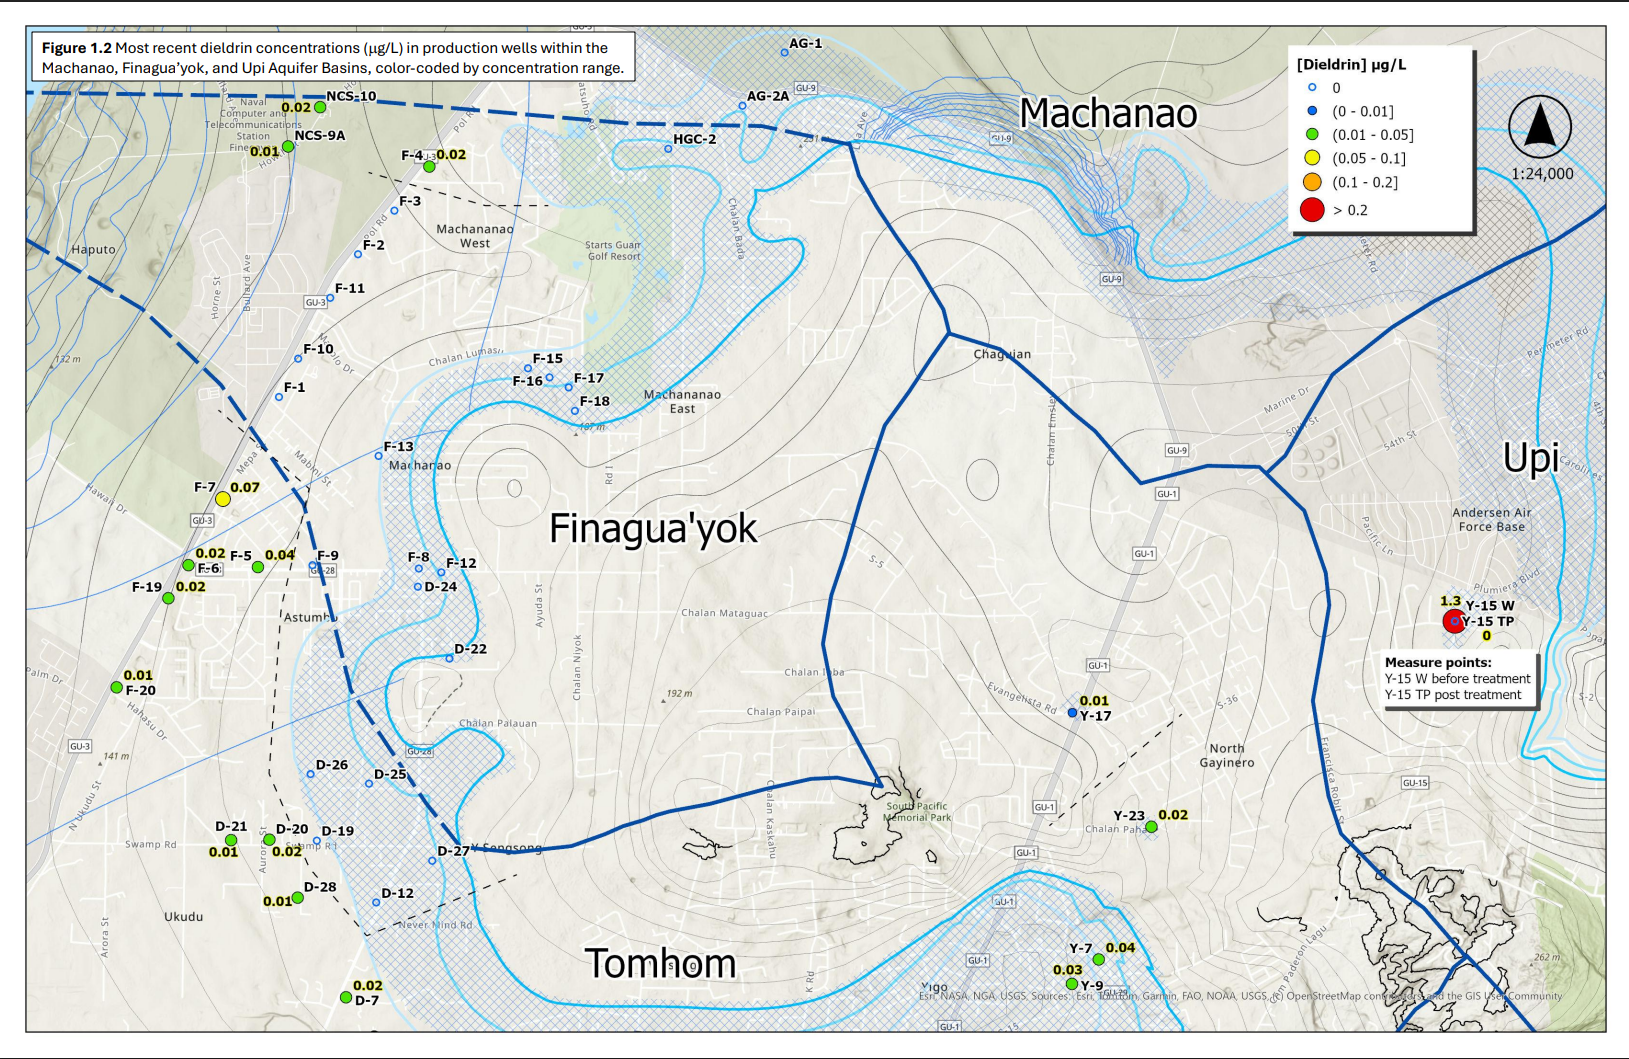
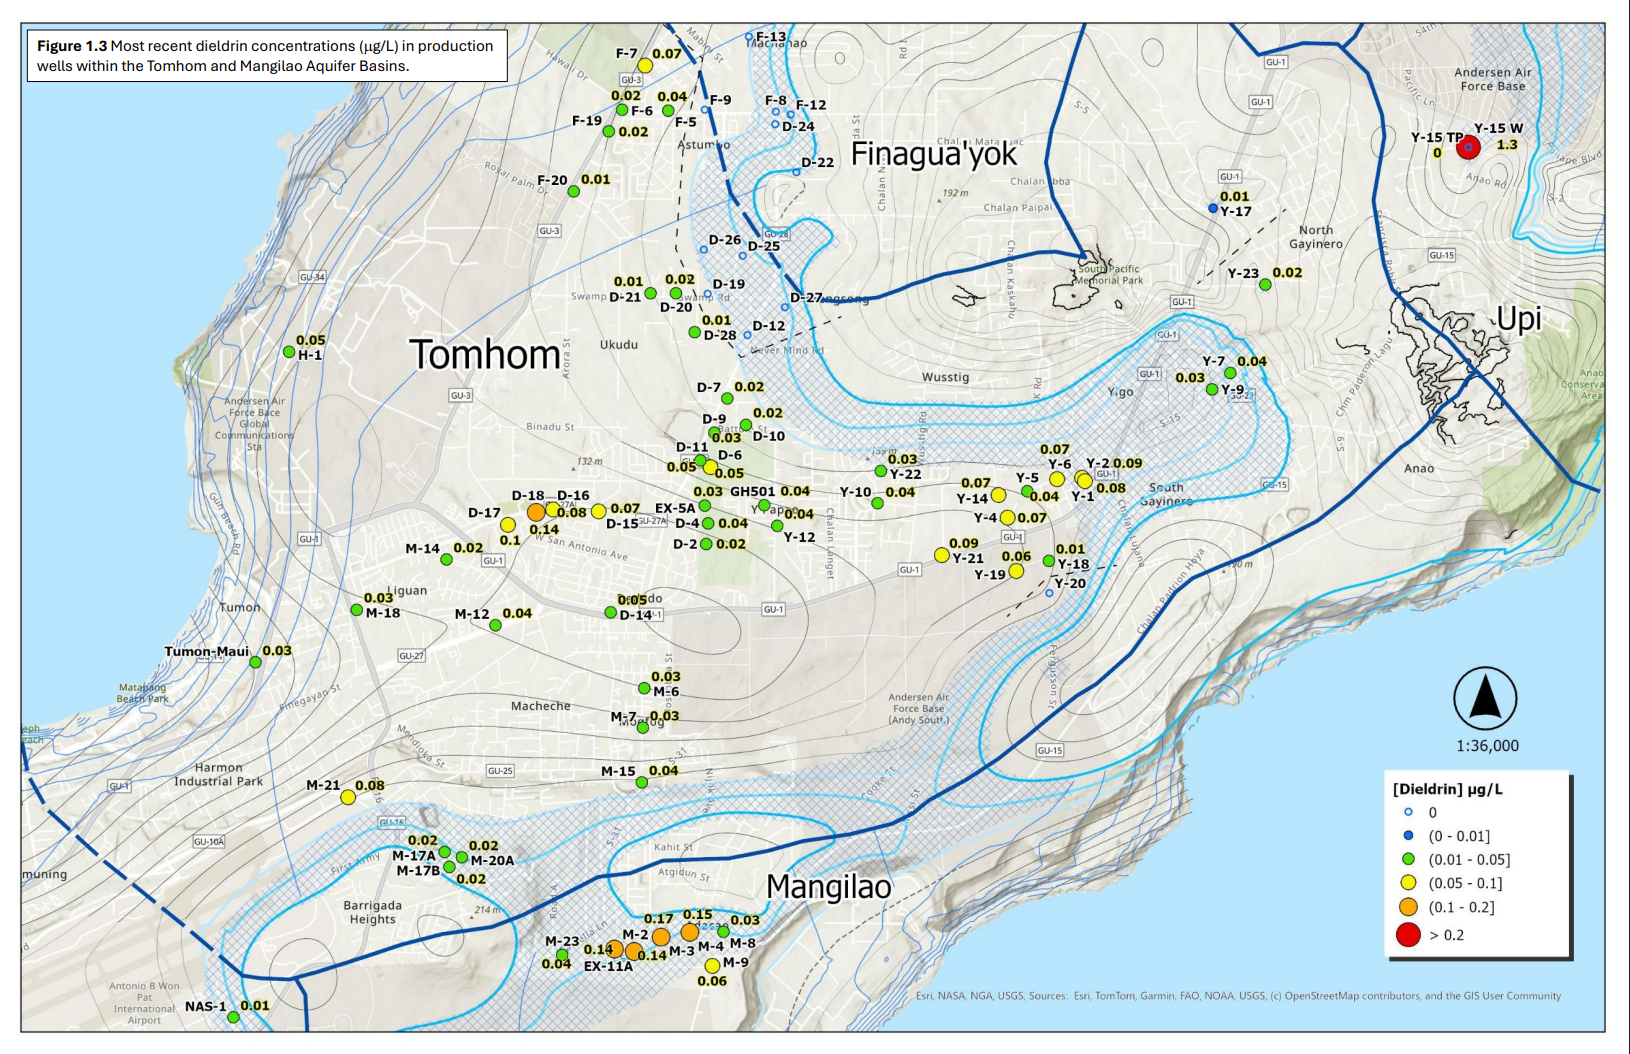
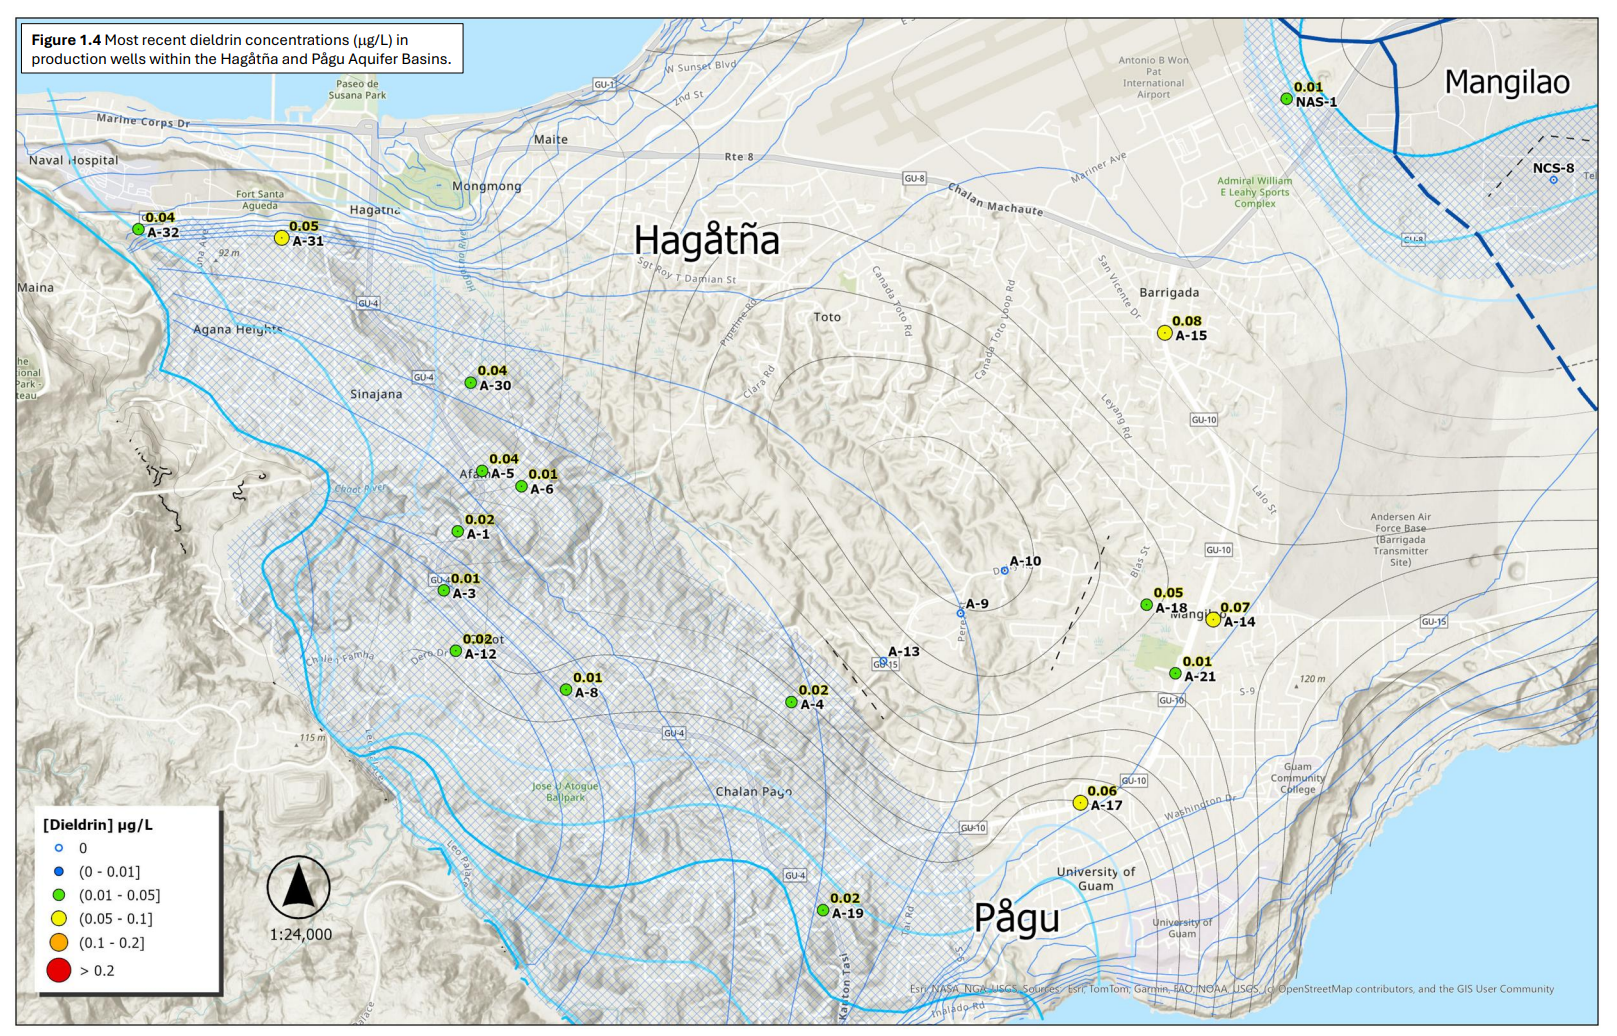
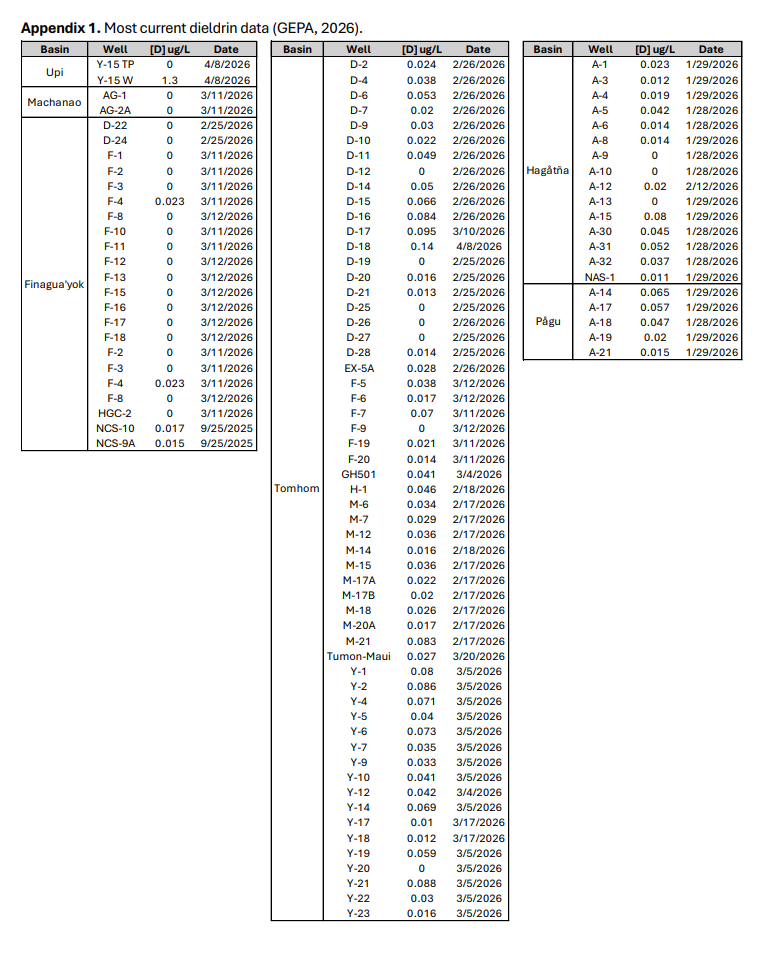
Figures 1.2-1.4 show recent mapped dieldrin concentrations, with little to no detection in the Finagua’yok Basin and part of the Hagåtña Basin near A-9, A-10, and A-13. Table 1 shows wells with elevated concentrations. Y-15 had a pre-treatment concentration of 1.3 µg/L, substantially above the IAL. Dieldrin was not detected after GAC treatment. Wells in the Tomhom and Mangilao basins (M-2, M-3, M-4, EX11A, and D-18) had concentrations greater than 0.10 µg/L. Although these concentrations are below the IAL, continued monitoring and further investigation of potential sources are warranted.
Table 1 Wells with dieldrin concentrations >0.1 (orange) and >IAL (red).
1.2 PFAS – Per- and Polyfluoroalkyl Substances
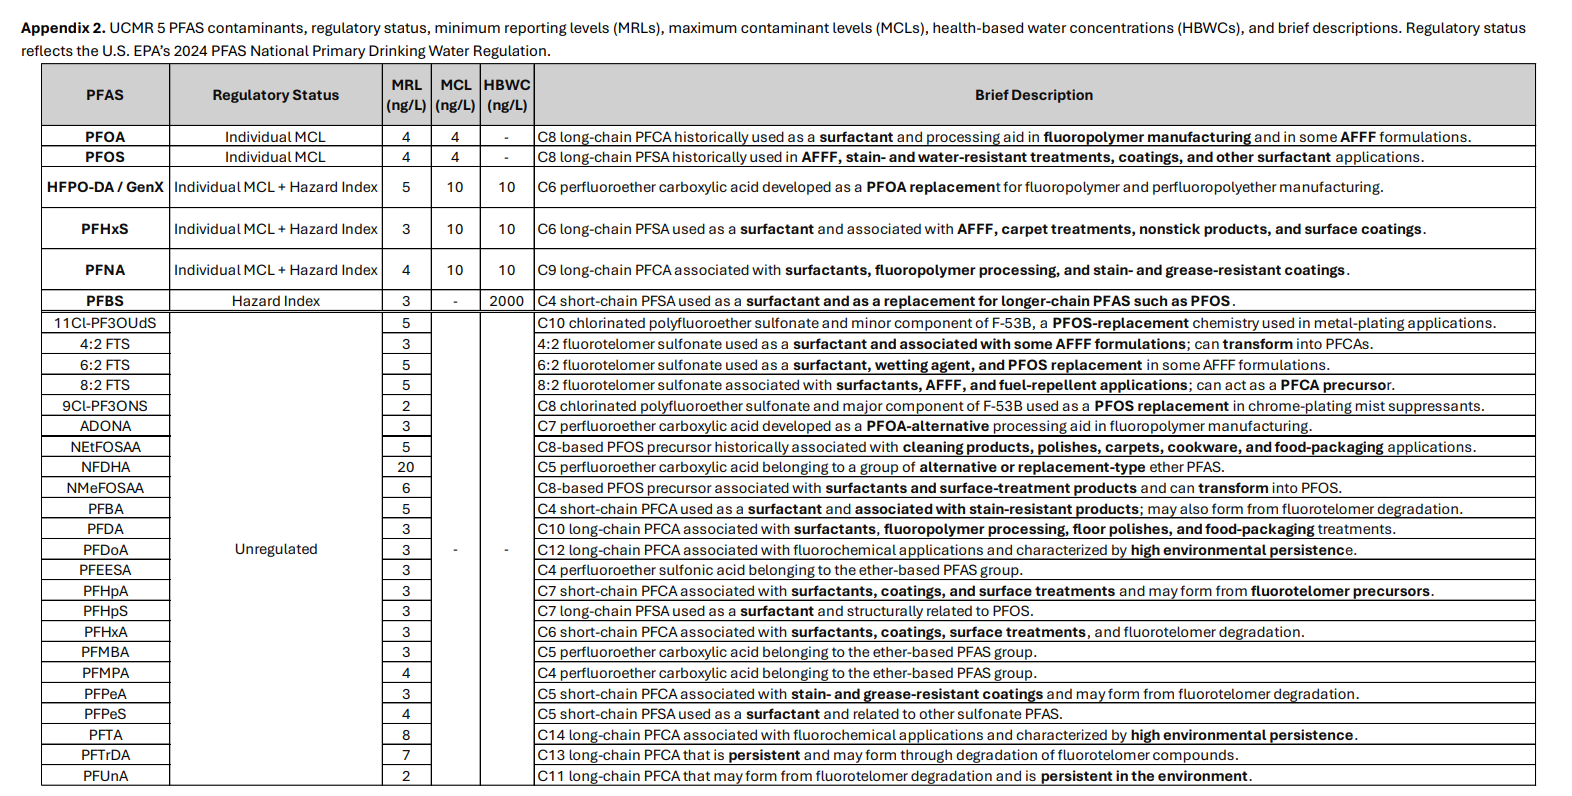
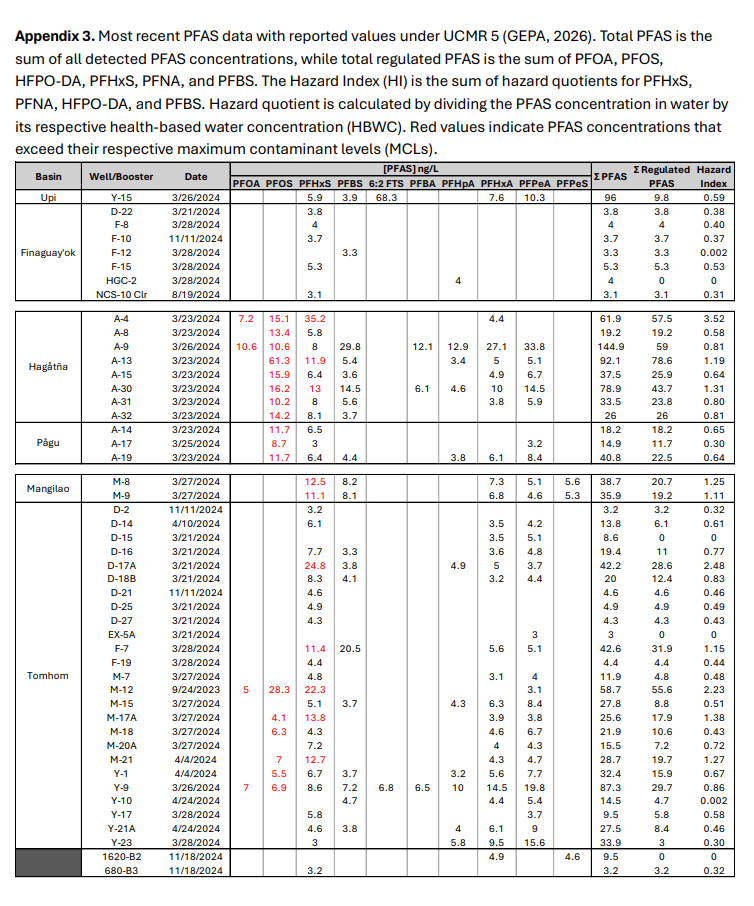
PFAS have been used for decades in aqueous film-forming foam (AFFF), nonstick cookware, waterrepellent fabrics, food packaging, and cosmetics (Mashima, 2025). Often called “forever chemicals,” PFAS resist degradation and persist in the environment. PFAS studies on Guam include research by Dr. Barry Kim and an M.S. Environmental Science thesis by Ms. Mallary Duenas. Monitoring under the fifth cycle of the U.S. EPA’s Unregulated Contaminant Monitoring Rule (UCMR 5) included testing for 29 PFAS from January 2023 through December 2025, several of which are subject to federal drinking-water standards (Appendix 2).
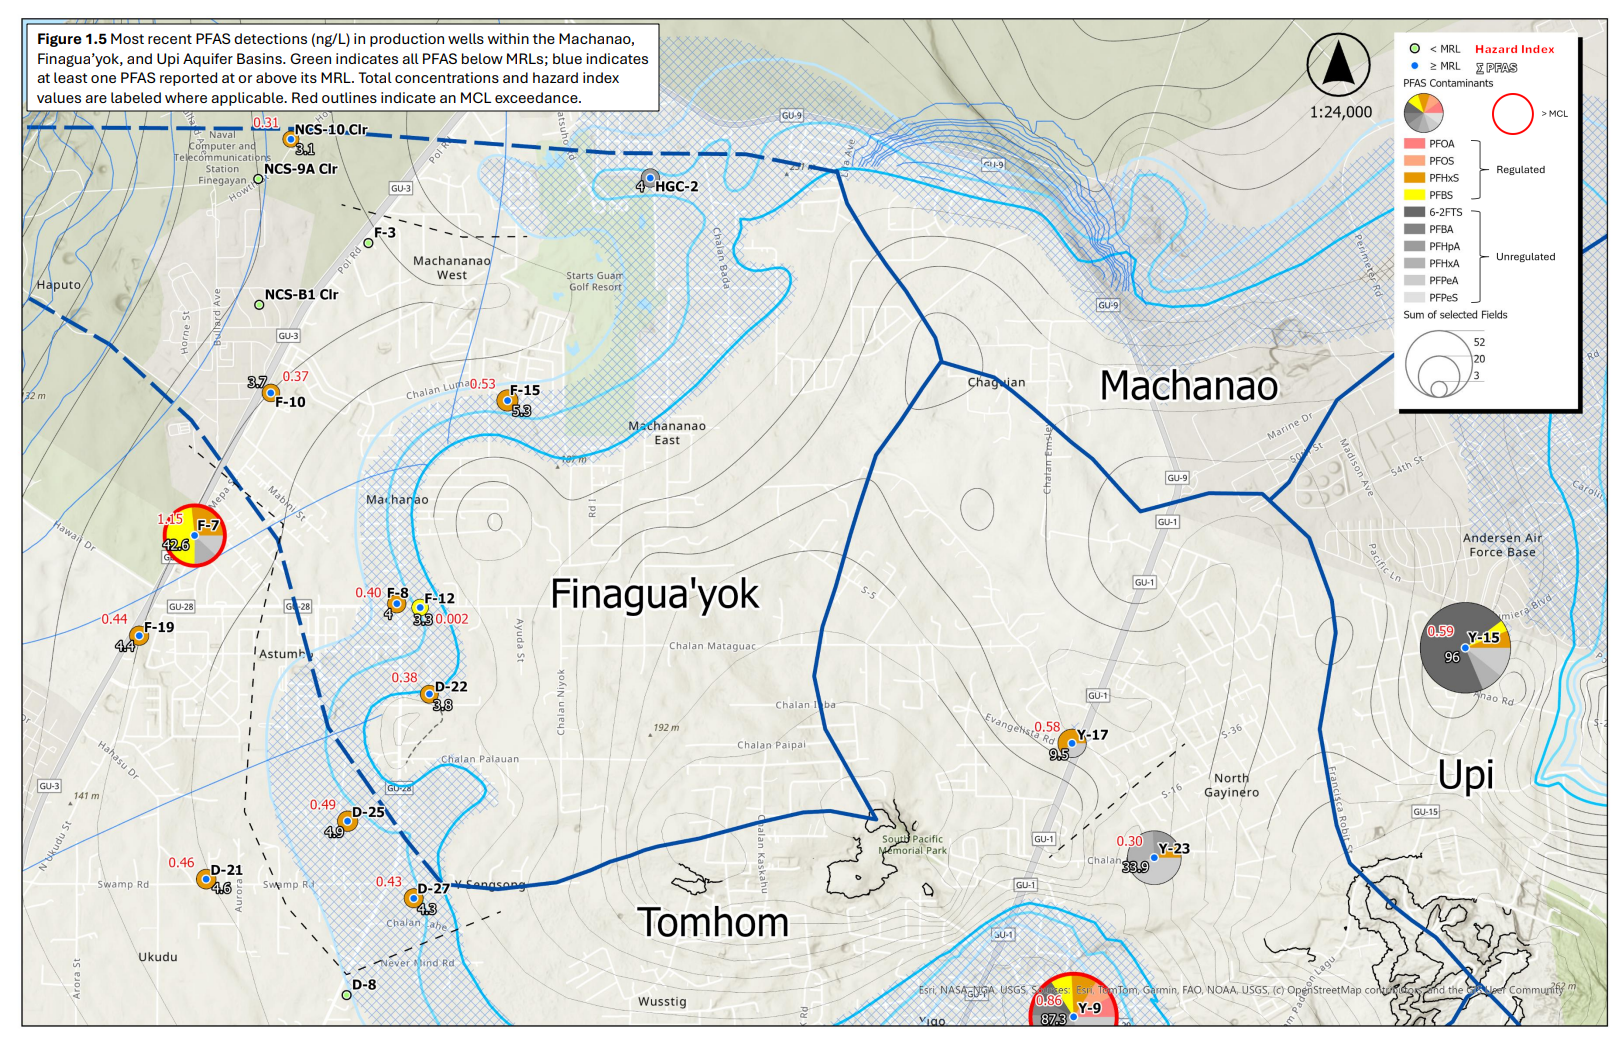
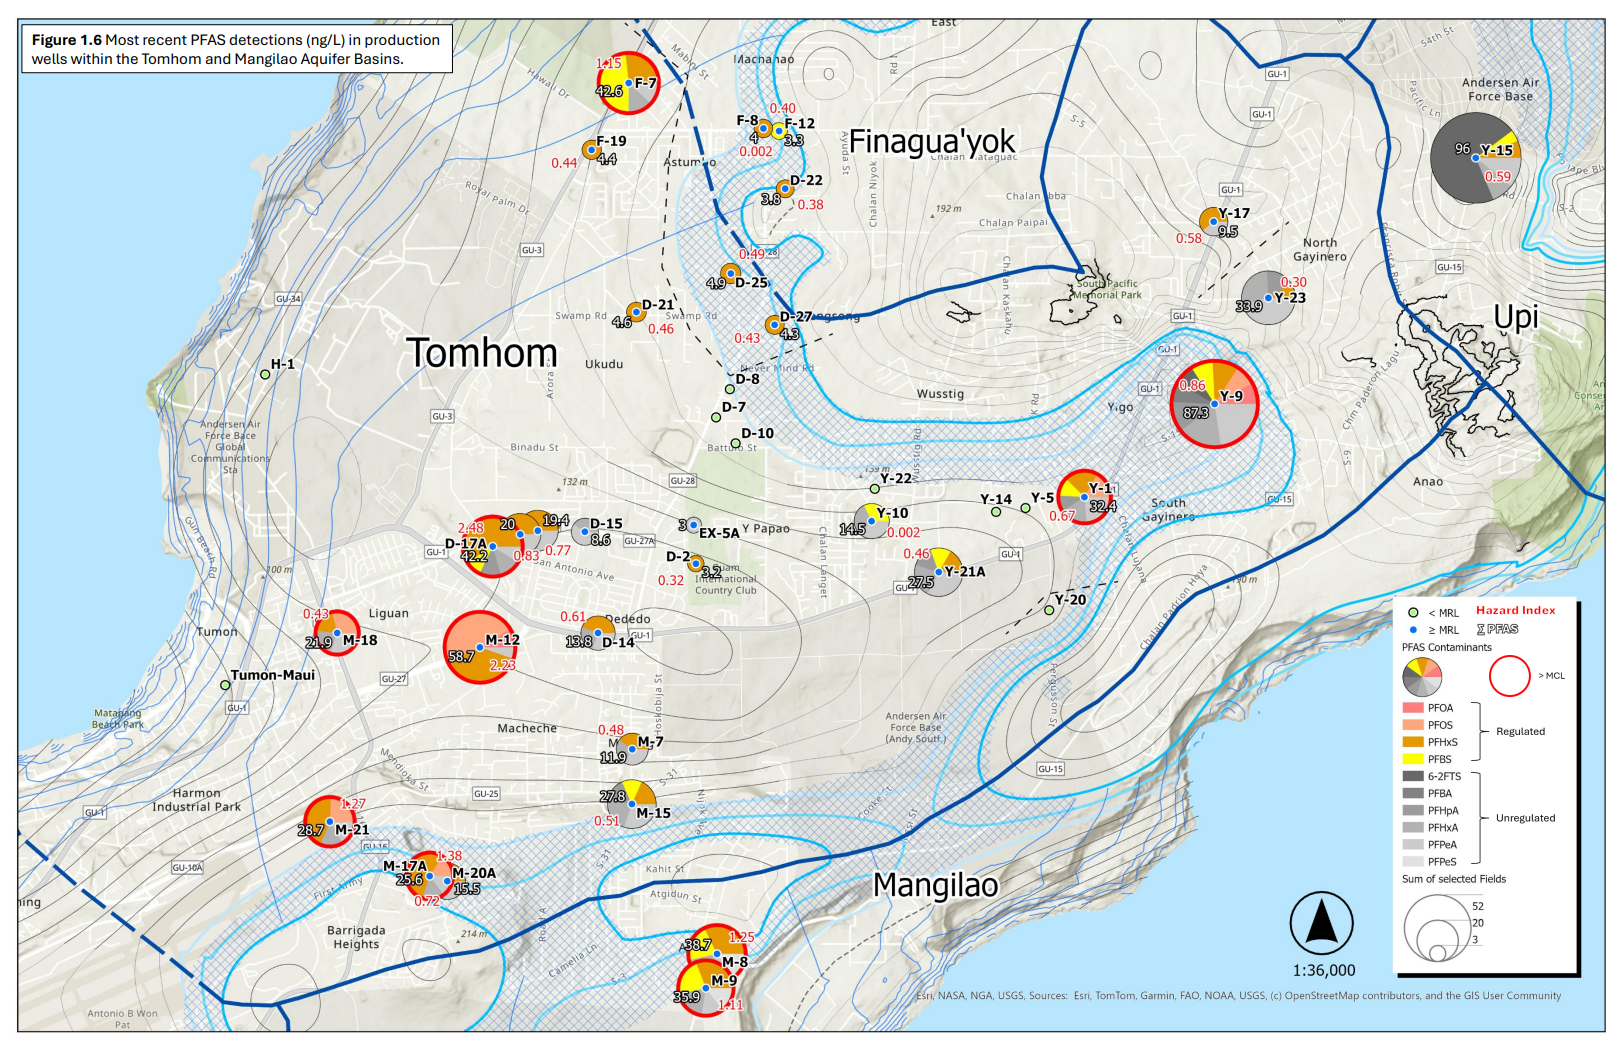
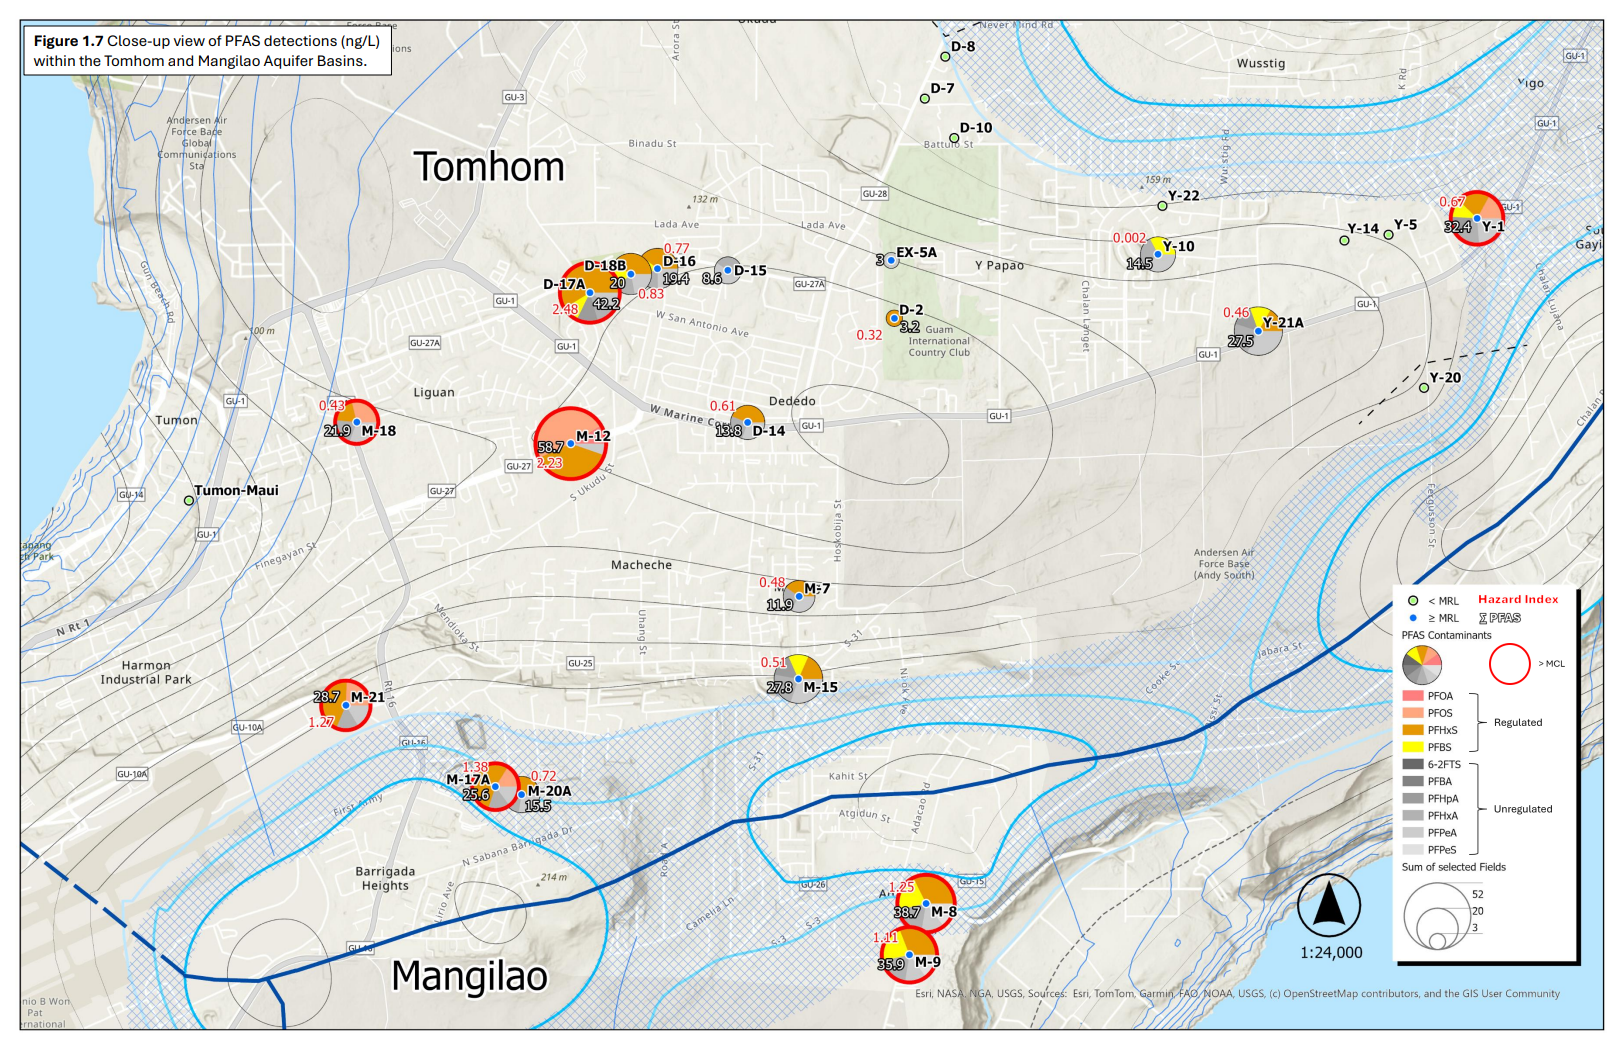
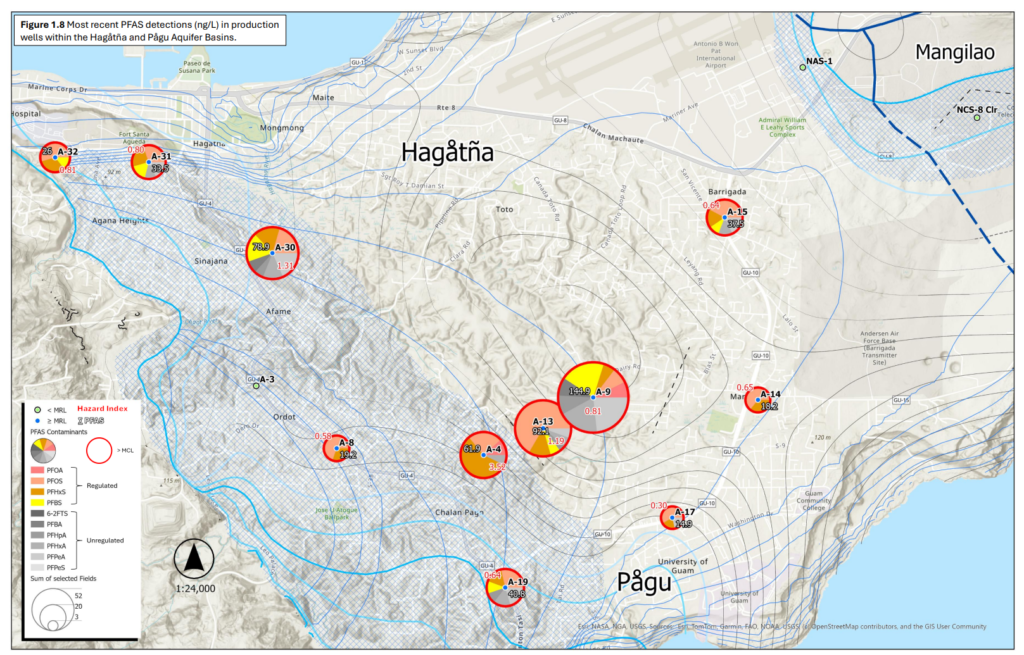
Figures 1.5–1.8 show the distribution of PFAS across the NGLA. A total of 48 facilities (production wells and booster stations) had at least one PFAS result at or above its respective minimum reporting level (MRL) (Appendix 3). PFHxS was widely detected in production wells across the Upi, Finagua’yok, Hagåtña, Pågu, Mangilao, and Tomhom basins. Among the 48 facilities, 21 wells had at least one regulated PFAS concentration above their respective maximum contaminant level (MCL). PFOA, PFOS, and PFHxS exceeded their respective MCLs, with most exceedances occurring in the Hagåtña, Pågu, Tomhom, and Mangilao basins.
Hazard Index (HI) values and total PFAS concentrations were also calculated for each well. The HI accounts for the combined potential health effects of PFHxS, PFNA, HFPO-DA, and PFBS. An HI greater than 1 indicates that the combined contribution of these PFAS exceeds EPA’s health-based benchmark for the mixture. Wells with HI (>1) included A-4, A-13, and A-30 (Hagåtña); M-8 and M-9 (Mangilao); and D17A, F-7, M-12, M-17A, and M-21 (Tomhom).
1.3 Nitrates
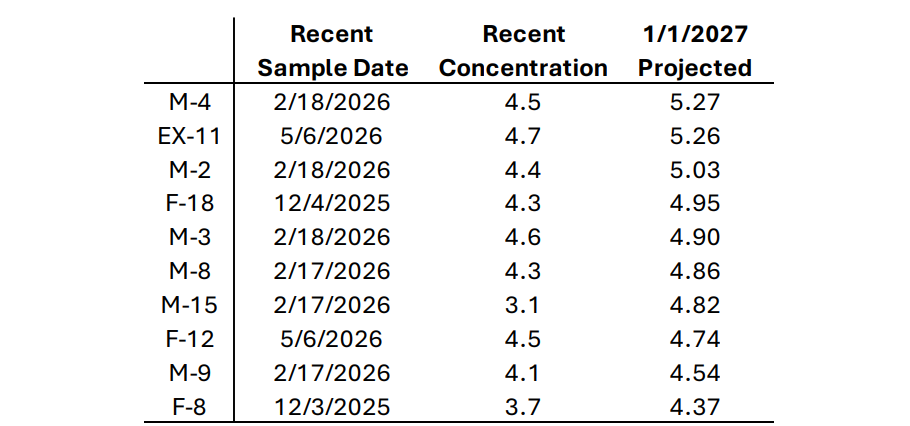
Nitrate, a common indicator of wastewater discharge, may enter the aquifer from leaking sewer lines, septic systems, and pits. The U.S. EPA maximum contaminant level (MCL) for Nitrate-N is 10 mg/L, with increased monitoring required when concentrations reach 50% of the MCL. Previous studies (McDonald 2002) and Bulaklak et al. (2020) identified potential nitrate sources and evaluated nitrate-N trends. Subsequently, Valerio et al. (2023) developed MAppFx: Production Well Nitrates Northern Guam Lens Aquifer, an interactive tool that integrates nitrate time-series data with statistical and trend analyses. Table 2 lists ten production wells with increasing linear nitrate-N trends. Three wells (M-2, M-4, and EX-11) are projected to reach or exceed 5 mg/L, equivalent to 50% of the MCL.
Table 2 Top 10 production wells with increasing nitrate-N trends (mg/L), ranked based on sampling
recency, projected nitrate-N concentration at the beginning of 2027, error analysis, and sample count.
2 RELATIVE OCEANIC NINO INDEX (RONI) AND RAINFALL
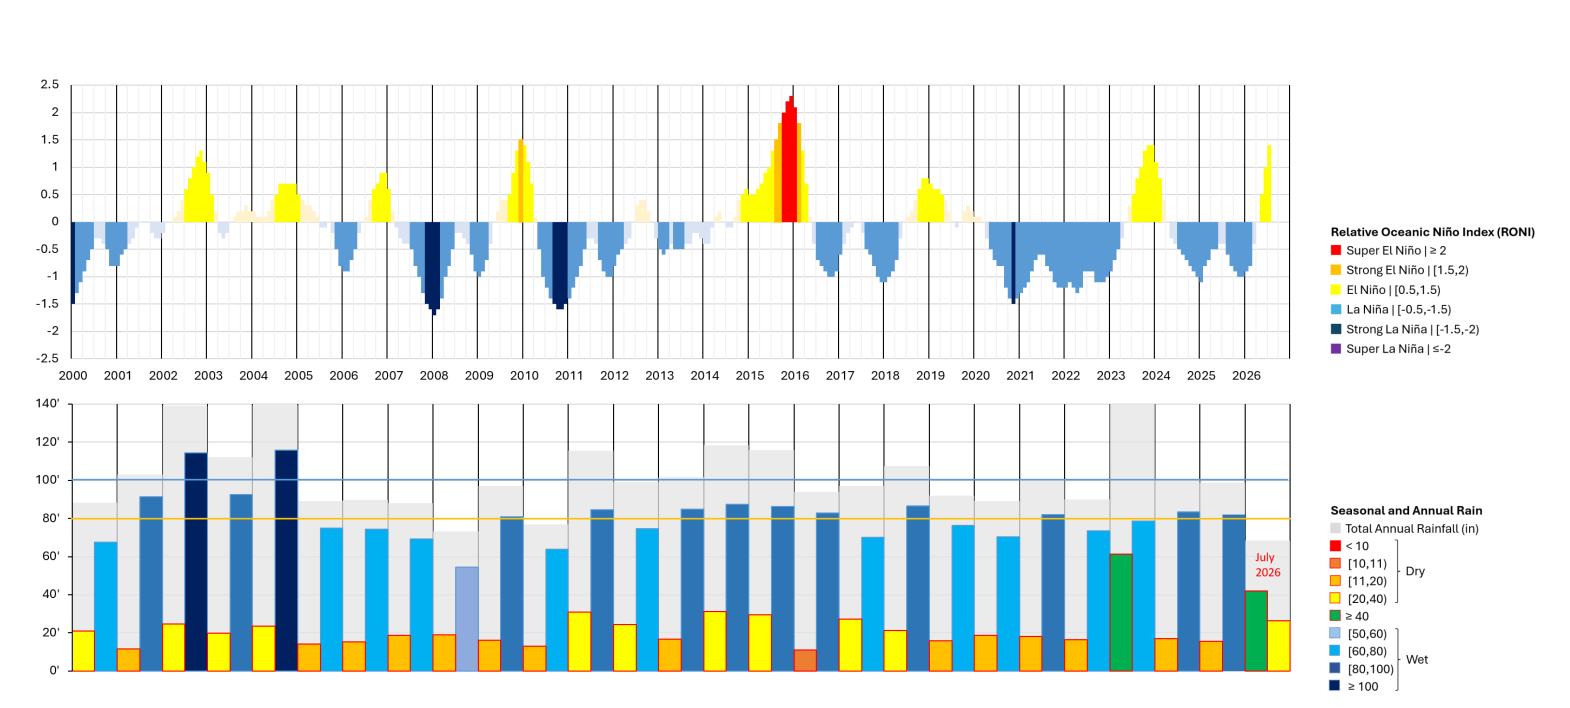
NOAA uses the Relative Oceanic Niño Index (RONI) to measure ENSO. In Figure 2.1, the upper graph shows RONI values from 2000 to July 2026 Values of +0.5 or greater indicate El Niño, while values of −0.5 or lower are La Niña events. The lower graph is annual and seasonal (wet-dry) rainfall from the NWS GIAA rain gage. ENSO can influence rainfall and drought, which may affect rainfall recharge to the aquifer.
3 CHLORIDE AND PRODUCTION
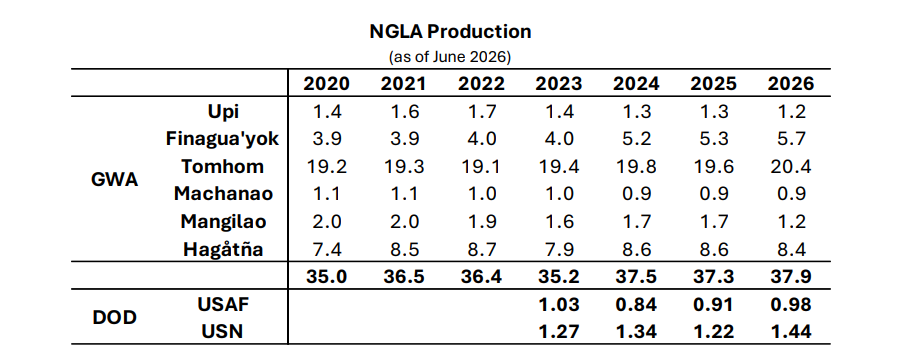
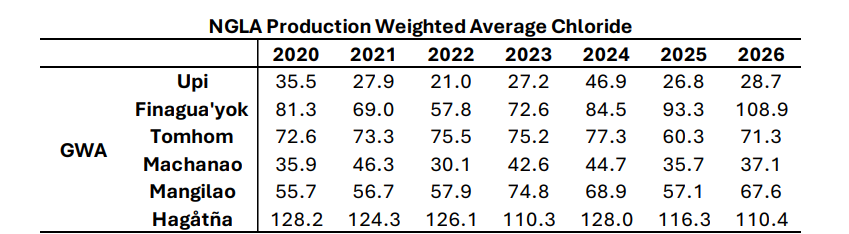
The NGLA is vulnerable to saltwater intrusion and overpumping. WERI Technical Reports 98, 143, and 188 analyzed pumping rates and chloride concentrations in production wells over time to support well operation and pumping management. MAppFx: Chloride and Production provides a view of updated production and chloride data. Table 3 summarizes NGLA production. As of June 2026, GWA production was ~38 MGD, with Tomhom being the most productive basin at 20.4 MGD. Military production totaled ~2.4 MGD, including 0.98 MGD from the USAF and 1.44 MGD from the USN. Table 4 shows the production-weighted average chloride concentrations, with Finagua’yok and Hagåtña having the highest values at 108.9 mg/L and 110.4 mg/L, respectively.
Table 3 NGLA production summary (MGD) for GWA and DOD, 2020 to June 2026.
Table 4 NGLA production weighted average chloride summary (mg/L) for GWA, 2020 to 2026.
4 DEEP OBSERVATION WELLS (DOWs)
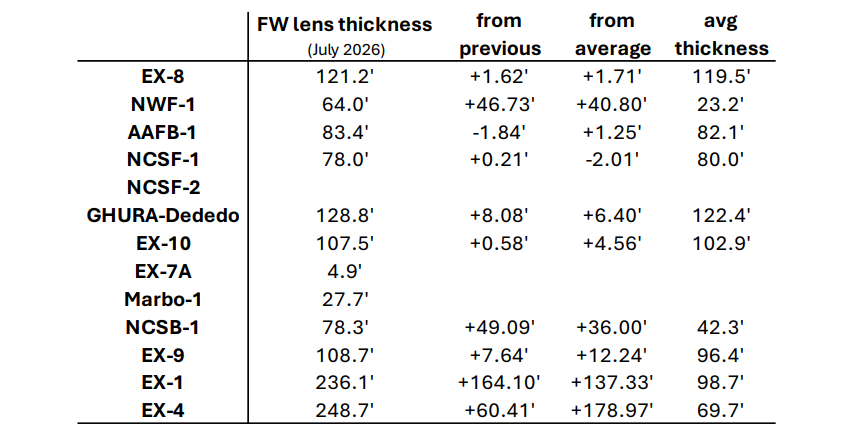
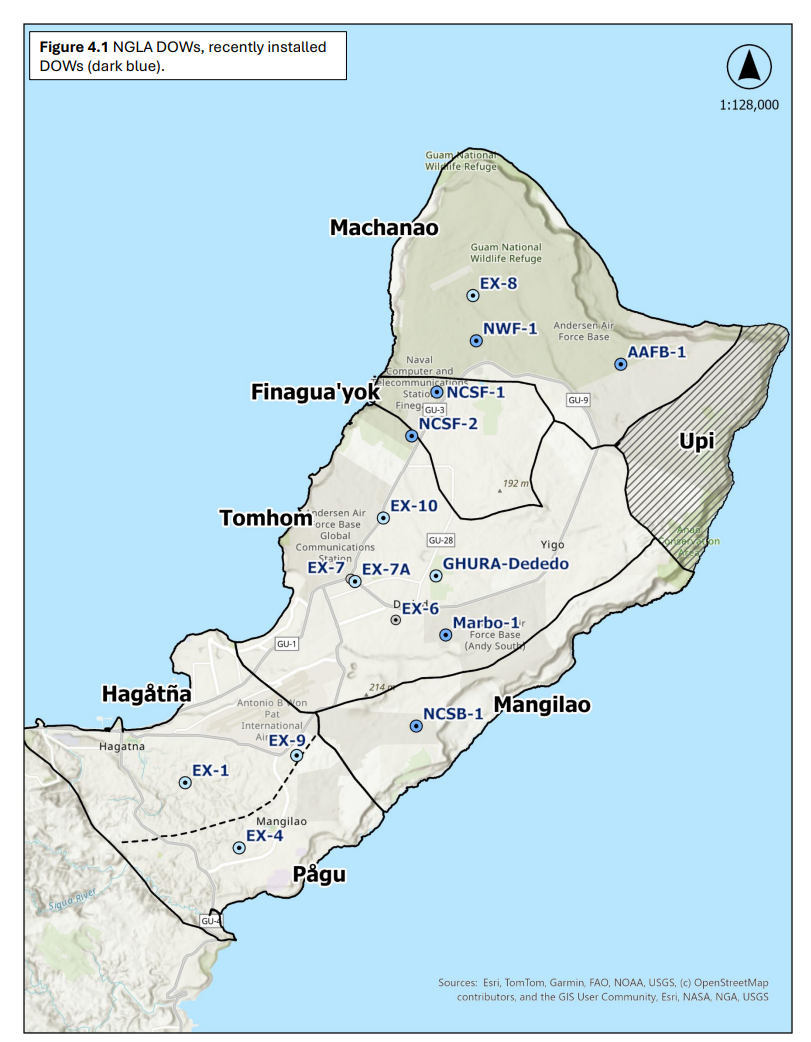
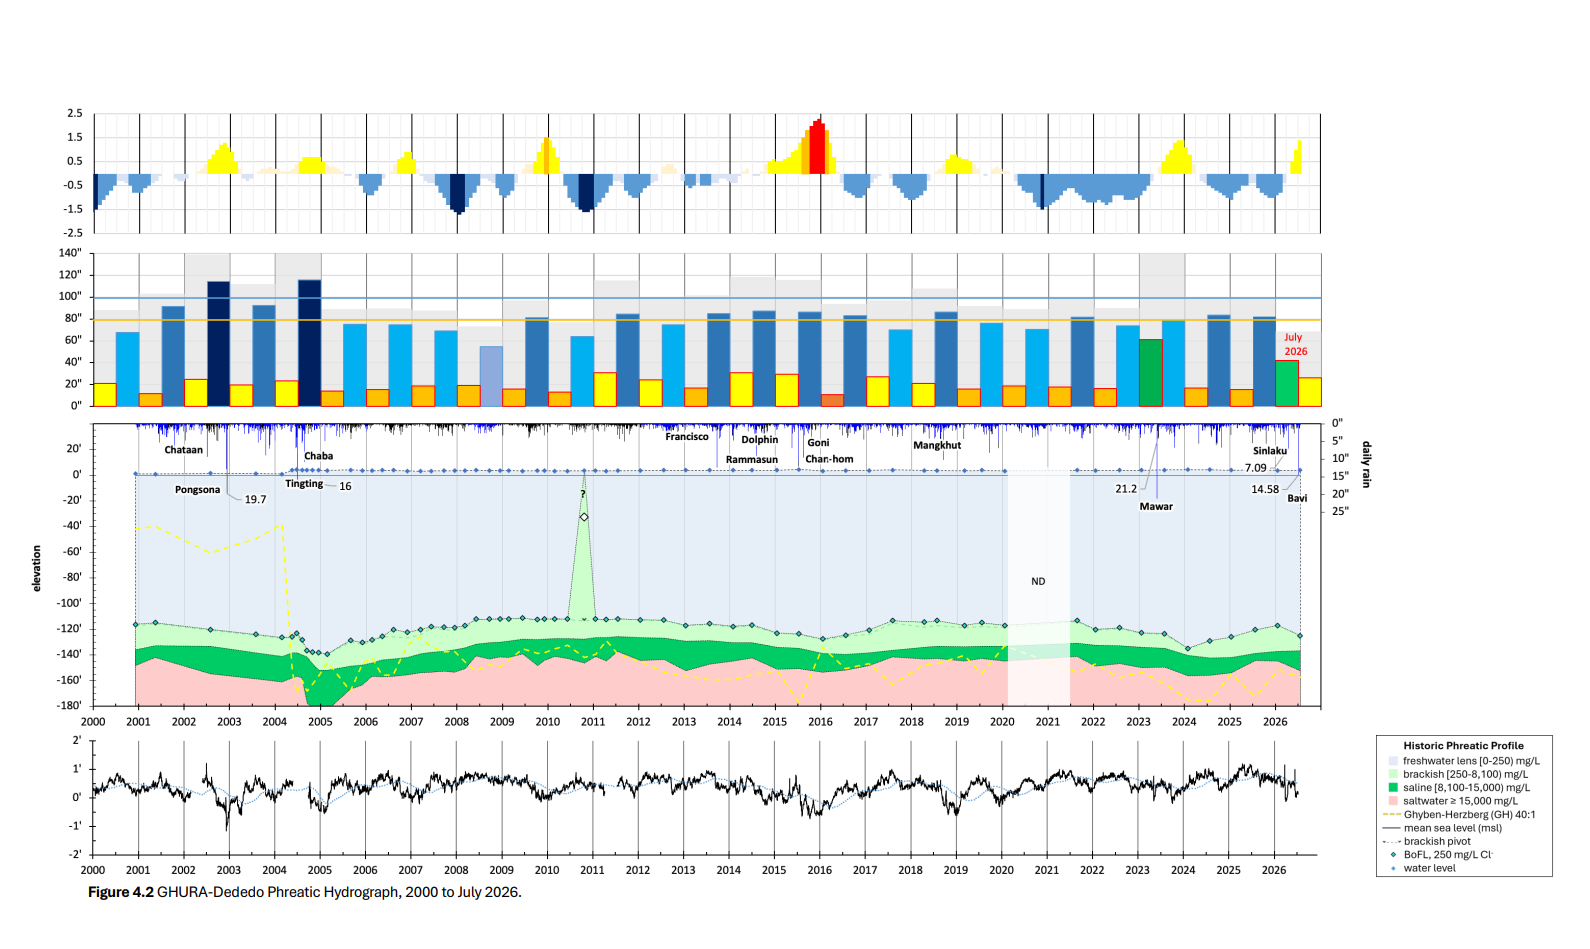
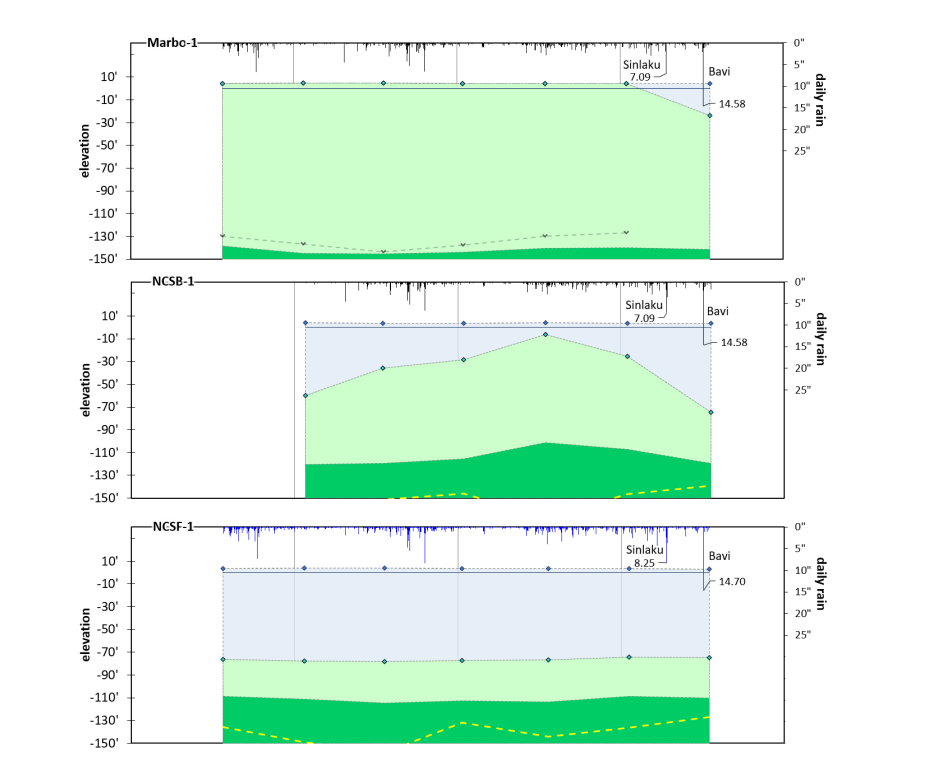
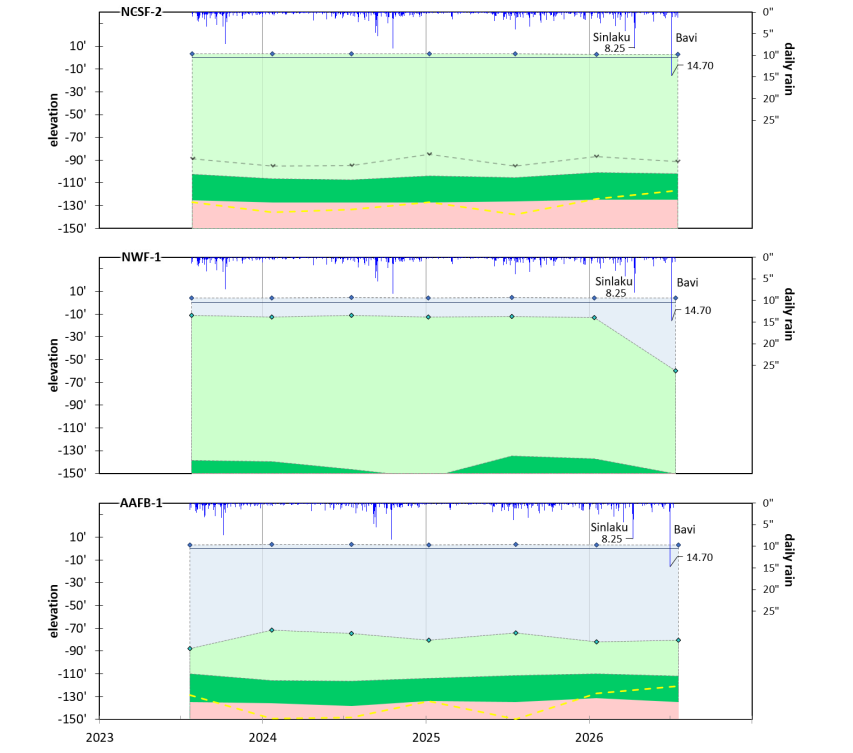
Long-term conductivity, temperature, and depth (CTD) data from DOWs were analyzed to study the freshwater lens within the NGLA (Figure 4.1). WERI Technical Report No. 189 evaluated changes in freshwater (FW) lens thickness and its response to recharge, drought, sea-level, and ENSO. Figure 4.2 shows the GHURA-Dededo phreatic hydrograph developed in the study. Since 2023, six recently installed DOWs have expanded observation in the Machanao, Finagua’yok, Tomhom, and Mangilao basins (Figure 4.3). Table 5 summarizes FW lens thickness across 13 DOWs.
Table 5 FW lens thickness of 13 DOWs, difference from previous collection and average thickness (ft).
Additional Figures
Figure 2.1 Relative Oceanic Nino Index (RONI) (top) and total and seasonal rainfall (bottom), NWS GIAA rain gage, 2000 to July 2026.
Figure 4.2 GHURA-Dededo Phreatic Hydrograph, 2000 to July 2026.
Figure 4.3 Historic phreatic profiles of six recently installed DOWs, 2023 to July 2026. Daily rainfall (secondary axis) from the USGS Dededo (black
lines) and Geomag (blue) rain gages.
All available reports (e.g., annual reports, state of the aquifer, etc.) and research areas are now in one place – check them out under Reports and Research.
We thank you for your patience as we continue to roll out updates and improve the site. If you need any help, feel free to reach out here.