Authors
Mary Clare Snaer, Nathan C. Habana, Yong Sang Kim, Leslie J. Camacho Aquino
WERI Technical Report
No. 189 (2026)
Publication
Table of Contents
Table of Contents
- Section 1
- Section 2
- Section 3
- Section 4
- Section 5
Abstract
The Northern Guam Lens Aquifer (NGLA) is Guam’s primary freshwater source, with a lens that responds dynamically to recharge, drought, and tidal influences. Building on the 2019 pilot study by Dougher et al., which focused on the Tomhom Basin, this study extends the analysis to the Machanao, Hagåtña, and Pågu Aquifer Basins. Using data from nine Deep Observation Wells (DOWs), this study examined the aquifer’s historic response to drought and storm-related recharge. Conductivity, temperature, and depth (CTD), rainfall, tide, and climate data from 2000 to 2024 were compiled to develop phreatic hydrographs for each DOW and evaluate freshwater lens response to recharge and drought. Results showed that lens thickness varied among DOWs, reflecting differences in recharge and drought response that may be influenced by local geology and DOW location. DOWs in the Barrigada Limestone, including those in the Tomhom and Machanao Basins, generally exhibited thicker and more stable freshwater lenses, whereas DOWs in the argillaceous Mariana Limestone of the Hagåtña and Pågu Basins showed thinner, more complex, and more erratic fresh to brackish lenses. Understanding these dynamic factors may contribute to improved groundwater model development for evaluating Guam’s water supply under different climatic and hydrogeologic conditions. The findings provide insight into aquifer behavior and may support future groundwater management strategies for Guam’s water security.
Keywords
Northern Guam Lens Aquifer, freshwater lens, Deep Observation Wells, recharge, drought, water security
Introduction
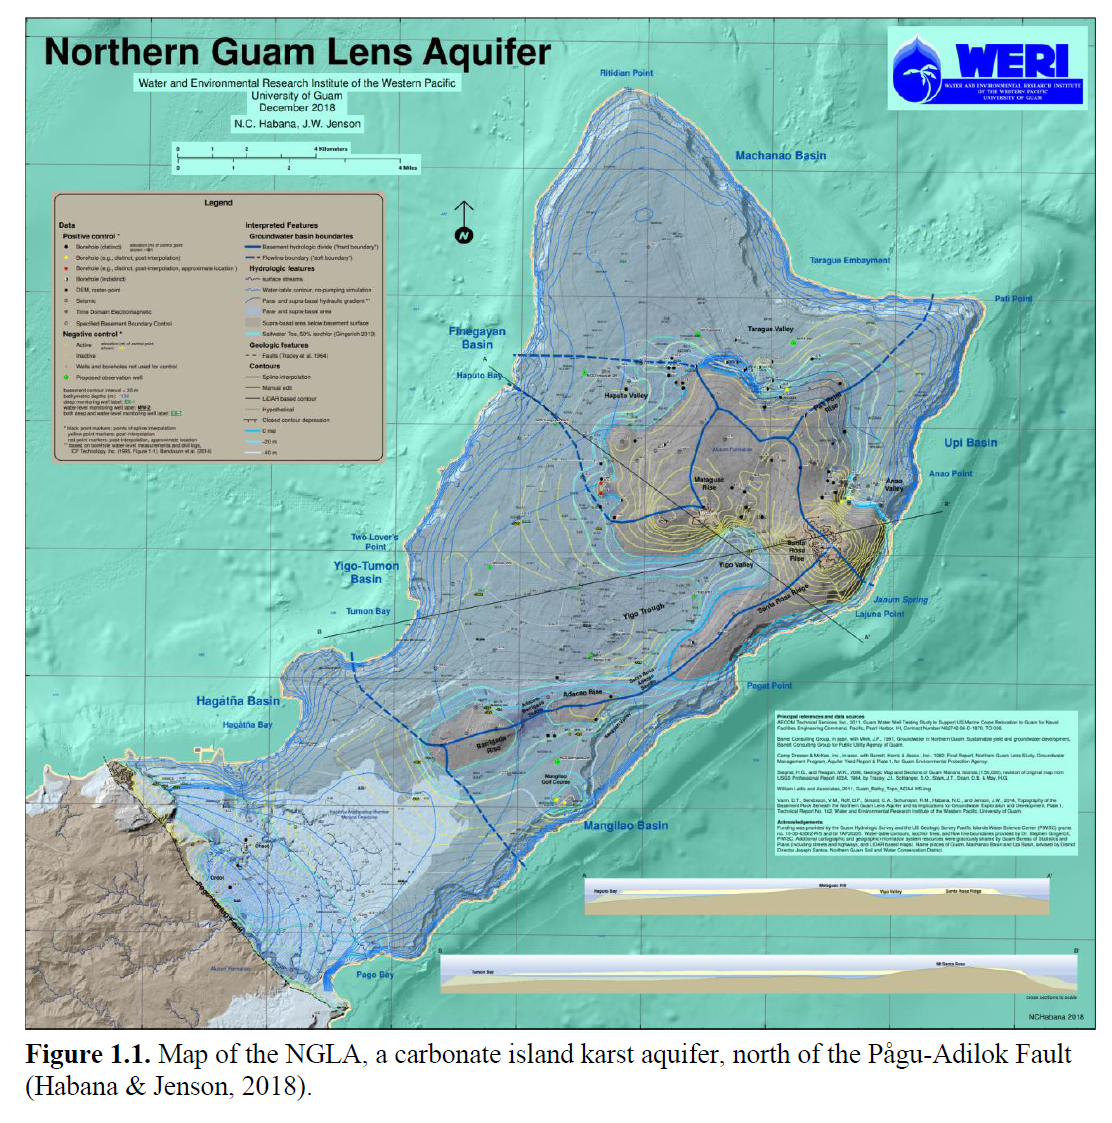
The Northern Guam Lens Aquifer (NGLA) contains a dynamic freshwater lens that supplies about 40 MGD, with ~20 MGD from the Tomhom Basin (Zapata et al., 2024), and responds to recharge, drought, and tidal fluctuations (Figure 1.1). As Guam’s primary groundwater resource, the aquifer plays a critical role in sustaining the island’s freshwater supply. Periods of abundant recharge can increase freshwater lens thickness, whereas prolonged drought can reduce it.
Because Guam relies heavily on the NGLA, understanding how the freshwater lens changes over time and across different parts of the aquifer is essential for effective long-term groundwater management.
A pilot study by Dougher et al. (2019) examined lens dynamics in the Tomhom Basin. Building on this groundwork, this project expands the investigation to the Machanao, Hagåtña, and Pågu aquifer basins. By analyzing Deep Observation Well (DOW) data from multiple basins, this study provides insight into how the lens responds to hydrologic and climatic influences. These results contribute to a better understanding of the response, capacity, and volume of Guam’s sole-source aquifer and may support sustainable groundwater use.
Statement of Water Resource Concern
The Big Drought of 1998 in Guam, during the post-peak El Niño phase following the Super El Niño and marked by annual rainfall of about 60 in, heightened concerns over the island’s water availability. This event emphasized the need for a more effective approach to managing water resources. In response, the Guam Hydrologic Survey (GHS) (GU PL 24-247) and the Comprehensive Water Monitoring Program (CWMP) (GU PL 24-161) were established, resulting in more than two decades of hydrologic and hydrogeologic data, including conductivity, depth, and temperature (CTD). GHS has since analyzed and processed these data collected through the CWMP.
As water demand continues to increase with population growth, careful and continuous monitoring of water resources remains necessary to prevent overpumping, particularly during prolonged drought. By measuring lens thickness, the quantity of groundwater available for extraction can be evaluated based on observed lens behavior.
Goals, Purpose, and Specific Objectives
The goal of this study is to apply hydrologic, geologic, and statistical analyses to data collected from nine DOWs within the NGLA. Additionally, this study aims to observe local variations in how the lens responds to recharge, drought, and tidal influences. The results will be important for improving groundwater modeling and for aquifer management, particularly with respect to the vulnerability and resilience of the aquifer under hydrologic and climatic stress.
The specific objectives of this study are to:
- collect and organize CTD, rainfall, tide, and climate data;
- construct hydrographs and conduct hydrologic, geologic, and statistical analyses;
- interpret the data and compare them to external hydrologic and climatic factors; and
- provide recommendations based on the analysis and results.
Scope, Delimitations, and Limitations
Scope: The study focuses on the Northern Guam Lens Aquifer, specifically within the Machanao, Tomhom, Hagåtña, and Pågu aquifer basins. The phreatic zone will be examined through nine DOWs: EX-8, EX-10, GHURA-Dededo, EX-7, EX-7A, EX-6, EX-9, EX-1, and EX-4.
Delimitations: The study is delimited to approved and available data from 2000 to 2024. Variables of interest include chloride concentration, raw conductivity, specific conductivity, and relationship of conductivity with depth and temperature. Historic DOW profiles were used to evaluate freshwater lens thickness, with the bottom of the freshwater lens defined by the 250 mg/L chloride threshold, as well as transition-zone behavior and the saltwater threshold at 15,000 mg/L chloride. External hydrologic factors considered in this study include rainfall, tide, and El Niño–Southern Oscillation (ENSO), represented by the Oceanic Niño Index (ONI). Six recently constructed military DOWs were not included because they have shorter periods of record and the data were not available at the time of analysis. Therefore, this study focuses on nine DOWs with long-term CTD records greater than four years.
Limitations: The major limitation of this study is the CTD data collection frequency. CTD profiles were initially collected quarterly and were later changed to semiannual collection. The most frequent data collection occurred after Typhoon Tingting in 2004, when CTD profiles were collected monthly through January 2005. From 2012 to present, CTD profiles were collected twice per year. In contrast, rainfall and tide data were recorded daily.
Benefits
Examining the freshwater lens through historic phreatic hydrographs reveals its temporal and spatial behavior across four aquifer basins and shows how lens dynamics vary in response to hydrologic and climatic influences in each basin. This study can support groundwater modeling by providing a baseline on which model accuracy can be evaluated. Accurate lens thickness data can also serve as essential input for groundwater models. Additionally, documenting lens dynamics during periods of abundant recharge and severe drought may help refine model parameters. The findings of this study may contribute to more informed groundwater management and long-term protection of Guam’s most important freshwater resource.
Background and Related Literature
This chapter reviews the background and related literature relevant to the Northern Guam Lens Aquifer (NGLA). It covers the aquifer setting, previous studies on salinity and deep observation wells (DOWs), and the data sources used in this study.
Geology
Tracey et al. (1964) conducted the foundational geologic mapping of the northern Guam plateau, identifying it as an uplifted and tilted plateau composed of limestone deposits that began forming during the Miocene–Pliocene (~16 Ma). These limestones unconformably overlie the Alutom Formation, a volcanic basement of early to middle Oligocene age (40–35 Ma) (Siegrist and Randall, 1992). The plateau is primarily composed of eogenetic Barrigada and Mariana Limestones (Vacher and Mylroie, 2002).
The Barrigada Limestone was deposited in a bank-type environment during the Miocene–Pliocene and forms most of the bedrock. It is mainly composed of massive, thick-bedded foraminiferal limestone. The younger Mariana Limestone was deposited in reef and lagoonal settings during the Pliocene–Pleistocene and rims the plateau. It includes detrital, molluscan, reef, and forereef facies, as well as the clay-rich Hagåtña Argillaceous Member in the Hagåtña Basin (Tracey et al., 1964).
The Hagåtña Basin lies along the Pågu-Adilok Fault, the southern margin of the northern plateau, adjacent to the volcanic Alutom Formation of southern Guam. Unlike the other northern groundwater basins, which are primarily underlain by the more permeable Barrigada and Mariana Limestones, the Hagåtña Basin contains more argillaceous limestone and is influenced by volcanic proximity. Weathering, erosion, and infiltration of volcanic material reduce limestone porosity and affect groundwater movement. This basin is merokarstic and represents a transitional zone between the volcanic rocks of southern Guam and the holokarstic limestones of the rest of the northern plateau (Cvijić, 1918; Ford and Williams, 2007).
The northern plateau is a karst carbonate island (Mylroie and Jenson, 2001) characterized by triple porosity, in which matrix, fracture, and conduit porosity enhance dissolution and groundwater circulation. Habana et al. (2022) further characterized the hydrologic terrain of the NGLA using GIS and LiDAR-based DEMs to delineate plateau basins and identify sinkholes, depressions, fractures, lineaments, and faults.
Based on the Geologic Map of Guam (Tracey et al., 1964; Siegrist and Reagan, 2008), EX-8, EX-7/7A, and EX-10 are in Mariana Limestone; EX-6 and GHURA-Dededo are within Barrigada Limestone; and EX-1, EX-4, and EX-9 penetrate the Hagåtña Argillaceous Member of the Mariana Limestone. Because lithology and subsurface structure may influence groundwater storage, mixing, and flow, geologic cross sections were constructed and analyzed to provide additional context for differences in DOW response to recharge.
Hydrology and Climatology
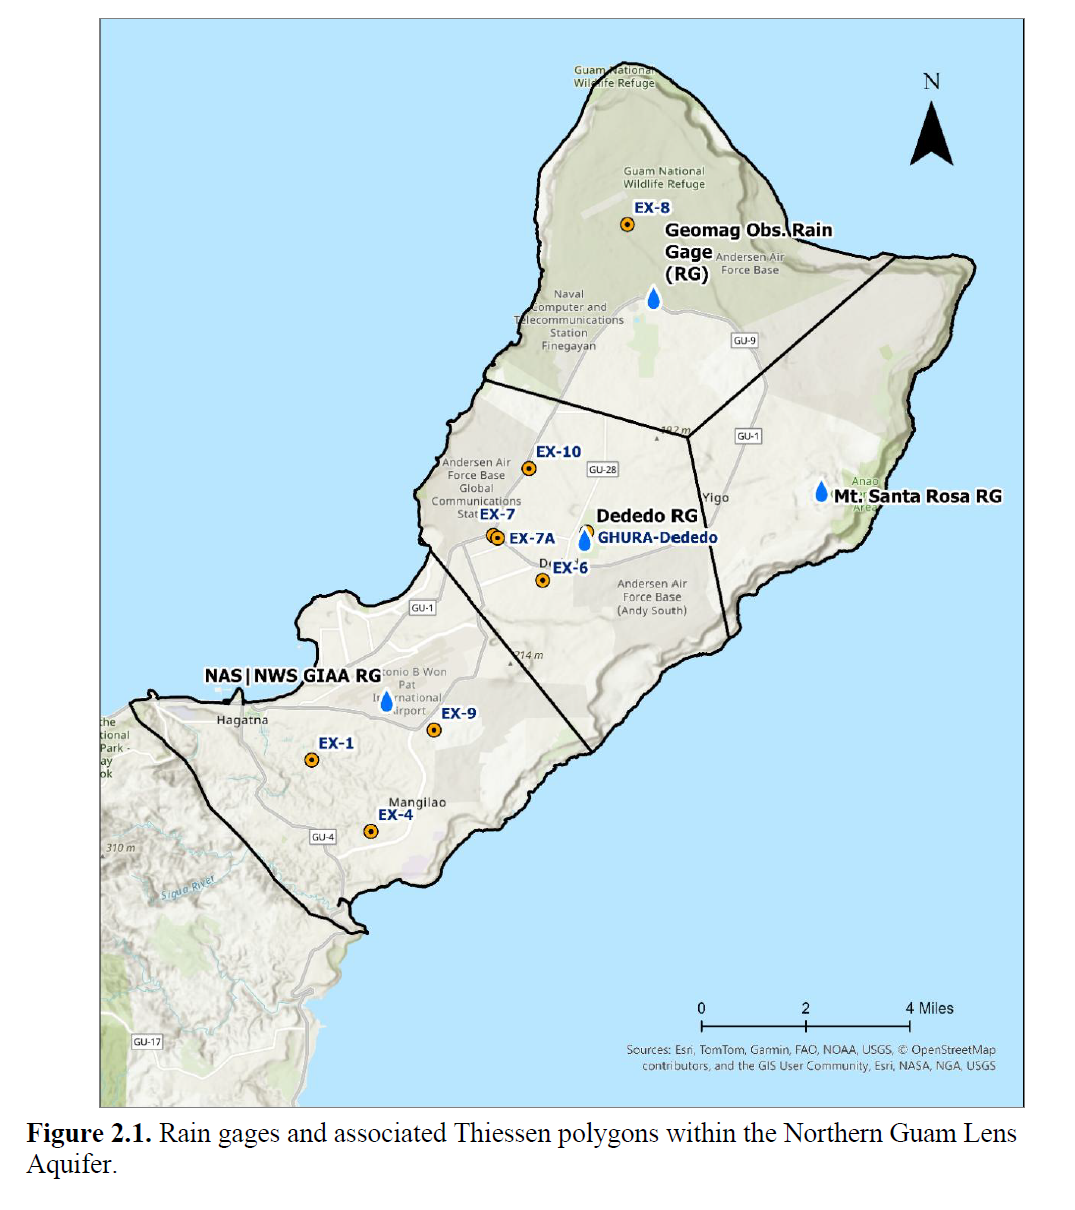
Guam has two distinct seasons, a dry season generally from January to June and a wet season from July to December. Rainfall is the only source of recharge, and seasonal and interannual rainfall variability strongly influences freshwater lens thickness. Average annual rainfall is approximately 100 in, and this study uses rainfall data from the USGS Dededo rain gage and the NOAA NWS rain gage to evaluate recharge (Figure 2.1).
Rainfall data from the NWS and Dededo rain gages were converted to semiannual and annual totals for comparison with the phreatic hydrographs. Rainfall may vary spatially across the island, especially during localized storm events. Therefore, rainfall totals from these gages may not fully represent recharge conditions at each DOW. However, during intense or long-duration storm events, especially typhoons, rainfall is more likely to occur across the island; therefore, the NWS and Dededo rain gages may better represent broader recharge conditions during those periods.
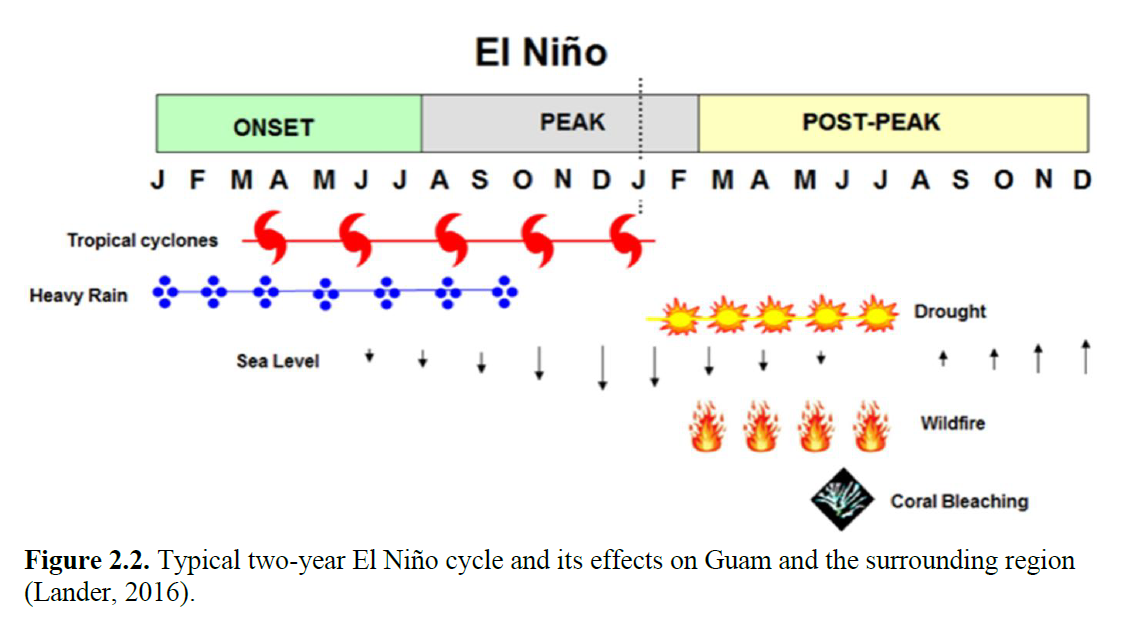
El Niño–Southern Oscillation (ENSO) strongly correlates with rainfall variability, tropical cyclone activity, and sea level changes in Guam. According to Lander (2016), the onset and peak phases of El Niño bring increased tropical cyclone activity and heavy rainfall to Guam and the surrounding region, whereas the post-peak phase is associated with prolonged drought, reduced rainfall, and sea-level changes (Figure 2.2).
During El Niño, the Intertropical Convergence Zone (ITCZ) tends to shift east of Guam, increasing the likelihood of typhoon activity affecting the island. During La Niña, the convergence zone shifts westward toward the Philippines and Guam may experience different rainfall patterns depending on storm tracks and regional circulation. These climate-driven shifts influence the timing and magnitude of recharge to the freshwater lens.
The Oceanic Niño Index (ONI) is one of the primary indicators used to monitor ENSO. It is based on three-month running averages of sea-surface temperature anomalies in the Niño 3.4 region (120°–170°W). Positive anomalies greater than +0.5 °C indicate El Niño conditions, whereas negative anomalies less than –0.5 °C indicate La Niña conditions (Lindsey, 2009).
Hydrogeology
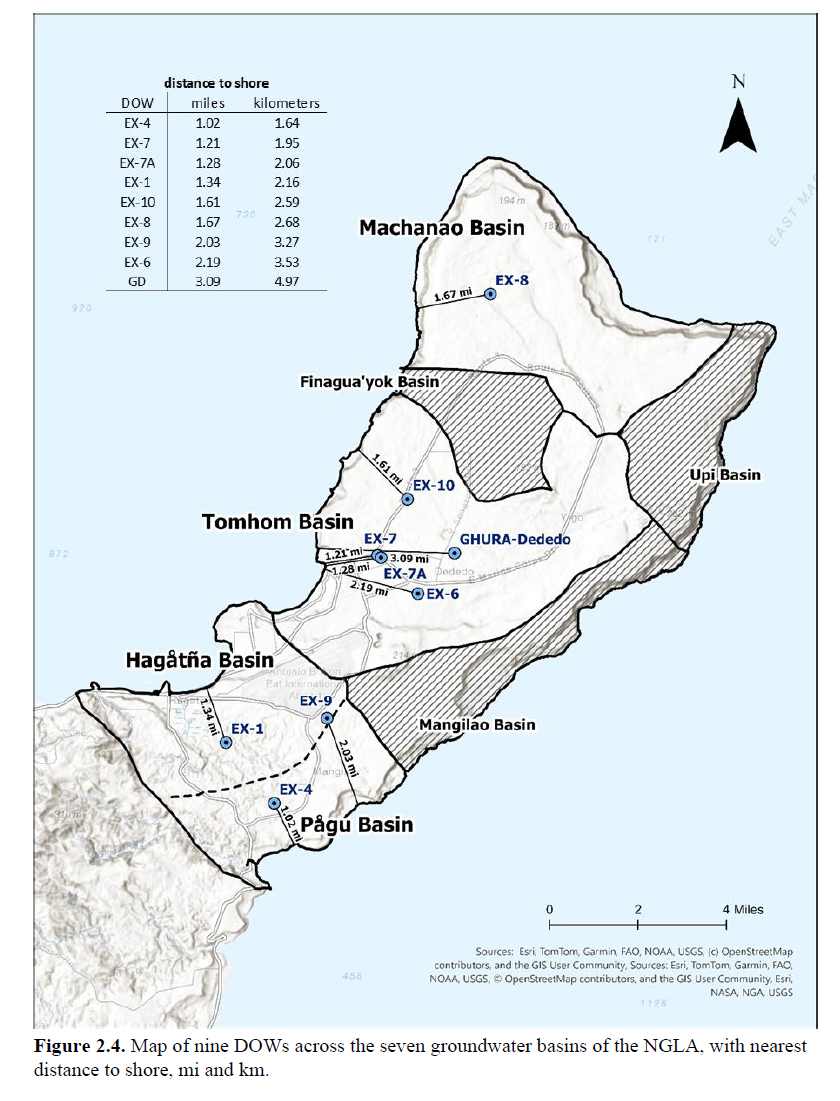
The Northern Guam Lens Aquifer (NGLA) is an unconfined aquifer in which a freshwater lens forms within permeable limestone and overlies denser saltwater (Figure 2.3). In 1978, USEPA designated the NGLA as Guam’s sole-source aquifer (USEPA, 1978). The aquifer is subdivided into seven groundwater basins (Figure 2.4) and three groundwater zones: basal, para-basal, and supra-basal (Mink, 1976).
Recharge to the phreatic zone occurs through autogenic and allogenic processes within the karst. Delayed hydrologic responses following significant recharge are commonly observed in aquifer systems. In northern Guam, Jocson et al. (2001) noted that hydraulic-head responses showed a striking similarity to streamflow hydrographs, indicating that recharge responses may occur over time rather than immediately after rainfall. Habana et al. (2009) also applied a hydrologic routing method to simulate the time distribution of recharge and the resulting hydraulic-head response after meteoric events. Although hydraulic head and freshwater lens thickness represent different aquifer responses, these studies provide important context for interpreting delayed freshwater lens thickening following major recharge events.
A vadose zone ranging from approximately 90-460 ft (27-140 m) thick separates the land surface from the phreatic zone and allows both slow and rapid recharge to occur Fast recharge moves through sinkholes, fractures, and conduits, whereas slow recharge moves through matrix porosity. The importance of these pathways depends on rainfall intensity, evapotranspiration, and local geology on infiltration.
A transition zone composed of brackish and saline groundwater forms the mixing interface between freshwater and underlying saltwater. The freshwater lens discharges along the coast through seepage and coastal springs and is also reduced by groundwater withdrawal from production wells (Gingerich, 2013).
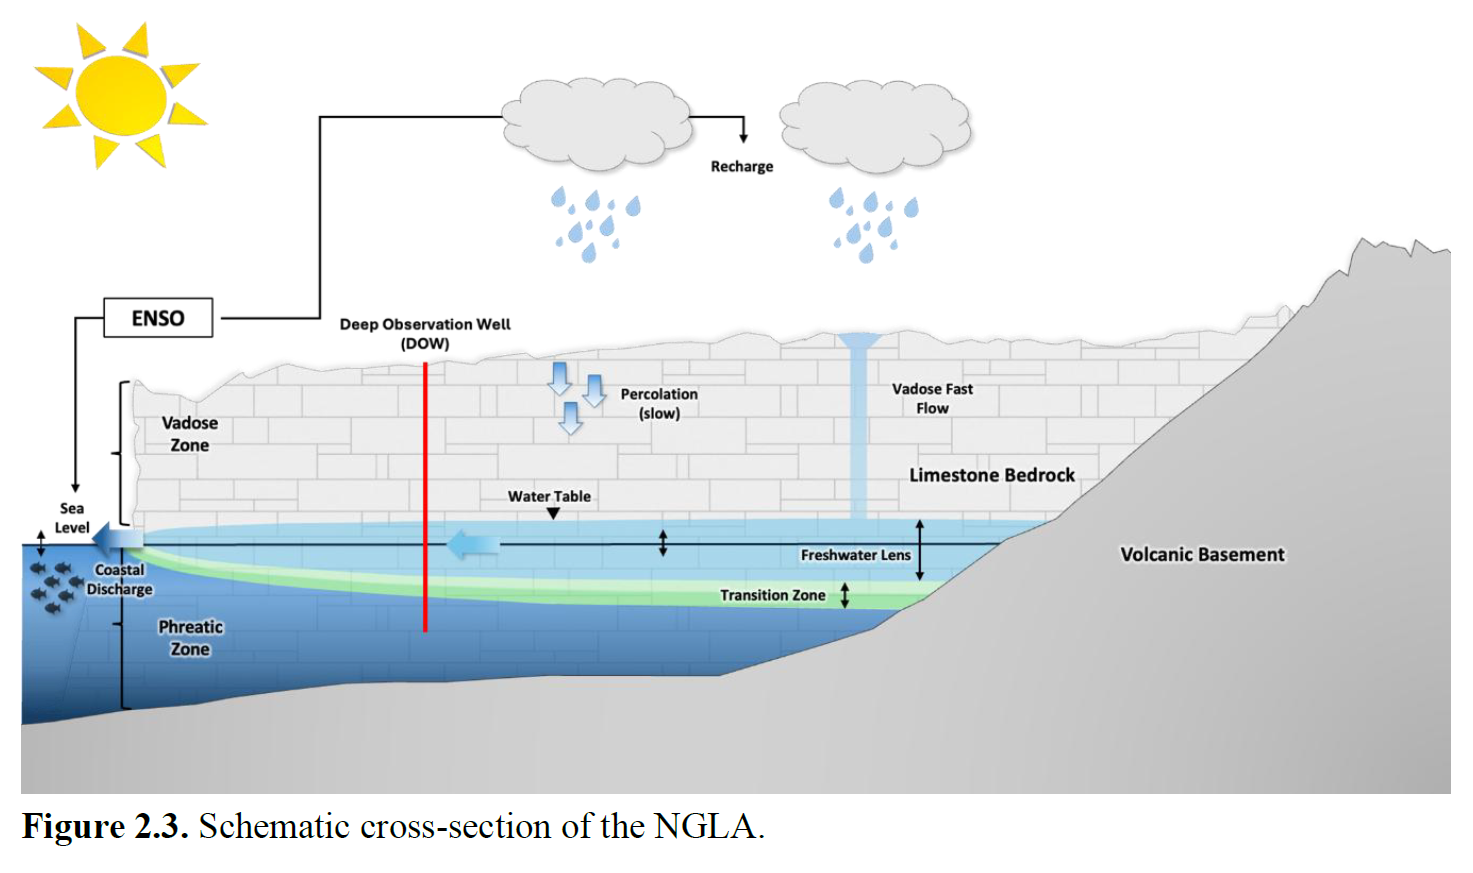
The Ghyben–Herzberg principle provides a rule-of-thumb estimate of freshwater thickness below mean sea level (msl), approximately 40 times the elevation of the water table above mean sea level (Fetter, 2001). However, freshwater lens thickness in the NGLA is dynamic and reflects the influence of recharge, drought, sea-level fluctuations, aquifer heterogeneity, and groundwater withdrawal. Previous studies have shown that the lens thins during drought and thickens following periods of substantial recharge (Dougher et al., 2019). Tidal influences have been known to affect freshwater lens position within the aquifer. Tidal effects are strongest near the coast and generally attenuate inland (Fetter, 2001).
Differences in limestone porosity and hydraulic conductivity across the NGLA also influence groundwater storage and lens behavior. For example, the Hagåtña Basin has lower porosity and hydraulic conductivity than areas underlain by the Barrigada and Mariana Limestones, which affects groundwater flow and mixing processes (Jocson et al., 1999; Gingerich, 2013).
Deep Observation Wells
The Comprehensive Water Monitoring Program (CWMP), established under Guam Public Law 24-161 in 1998, led to the rehabilitation and long-term monitoring of deep observation wells (DOWs) across northern Guam (Guam Legislature, 1998). These wells penetrate the freshwater lens, transition zone, and underlying saltwater, allowing direct measurement of lens thickness. Figure 2.4 shows the DOW locations and their nearest distances from shore, with EX-4 closest to the coast (~1 mi) and GHURA-Dededo the most inland (~3 mi).
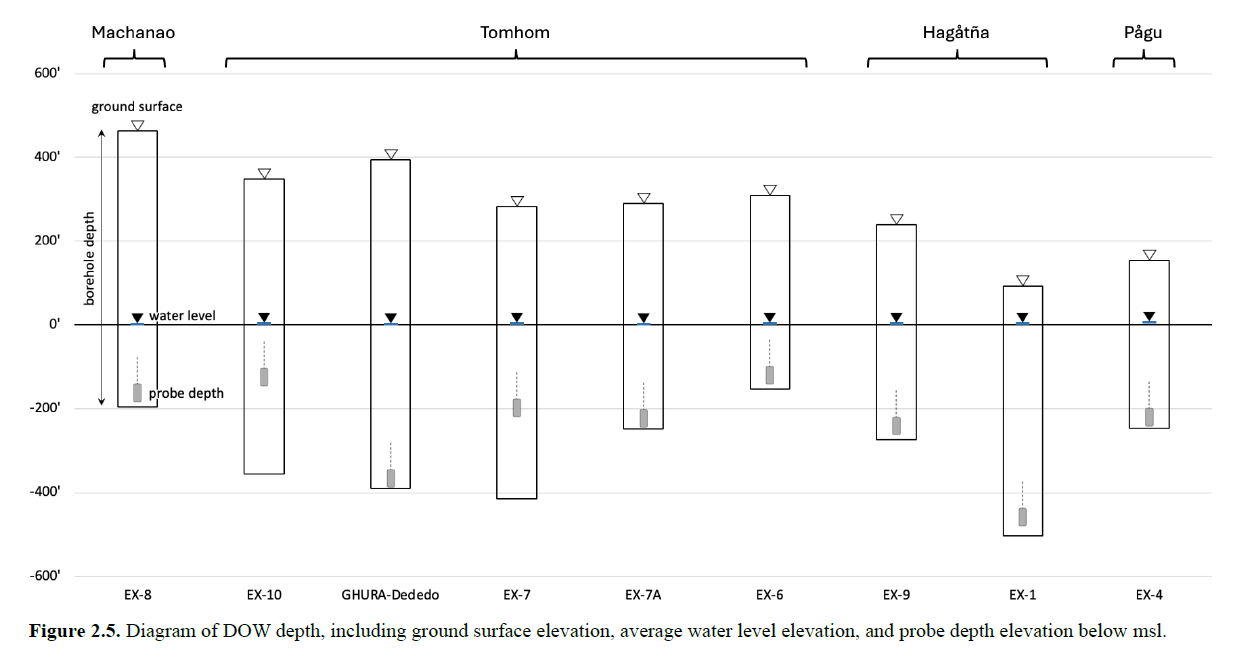
All DOWs, except EX-7, EX-7A, and EX-6, were active observation wells throughout most of the study period. EX-7 was properly abandoned in 2017 due to the widening of Route 1 (GEPA, 2014). A replacement DOW, EX-7A, was drilled approximately 500 ft southeast of EX-7 near the Route 1–Route 3 intersection in 2019, and data collection began in 2021. EX-6 was active from 2000 to 2008. Figure 2.5 shows a comparison of DOW depth, ground-surface elevation, average water-level elevation, and probe depth elevation, illustrating the extent to which individual wells capture the freshwater lens, transition zone, and saltwater.
The U.S. Geological Survey (USGS) Pacific Islands Water Science Center (PIWSC) conducts semiannual fieldwork on Guam to collect conductivity, temperature, and depth (CTD) profiles and water-level data from the DOWs. These data are used to evaluate freshwater lens thickness and transition zone behavior through time. The earlier period of record, particularly prior to 2004, reflects a transitional stage in CTD data collection. After 2004, refinements in field methods resulted in a more consistent data collection.
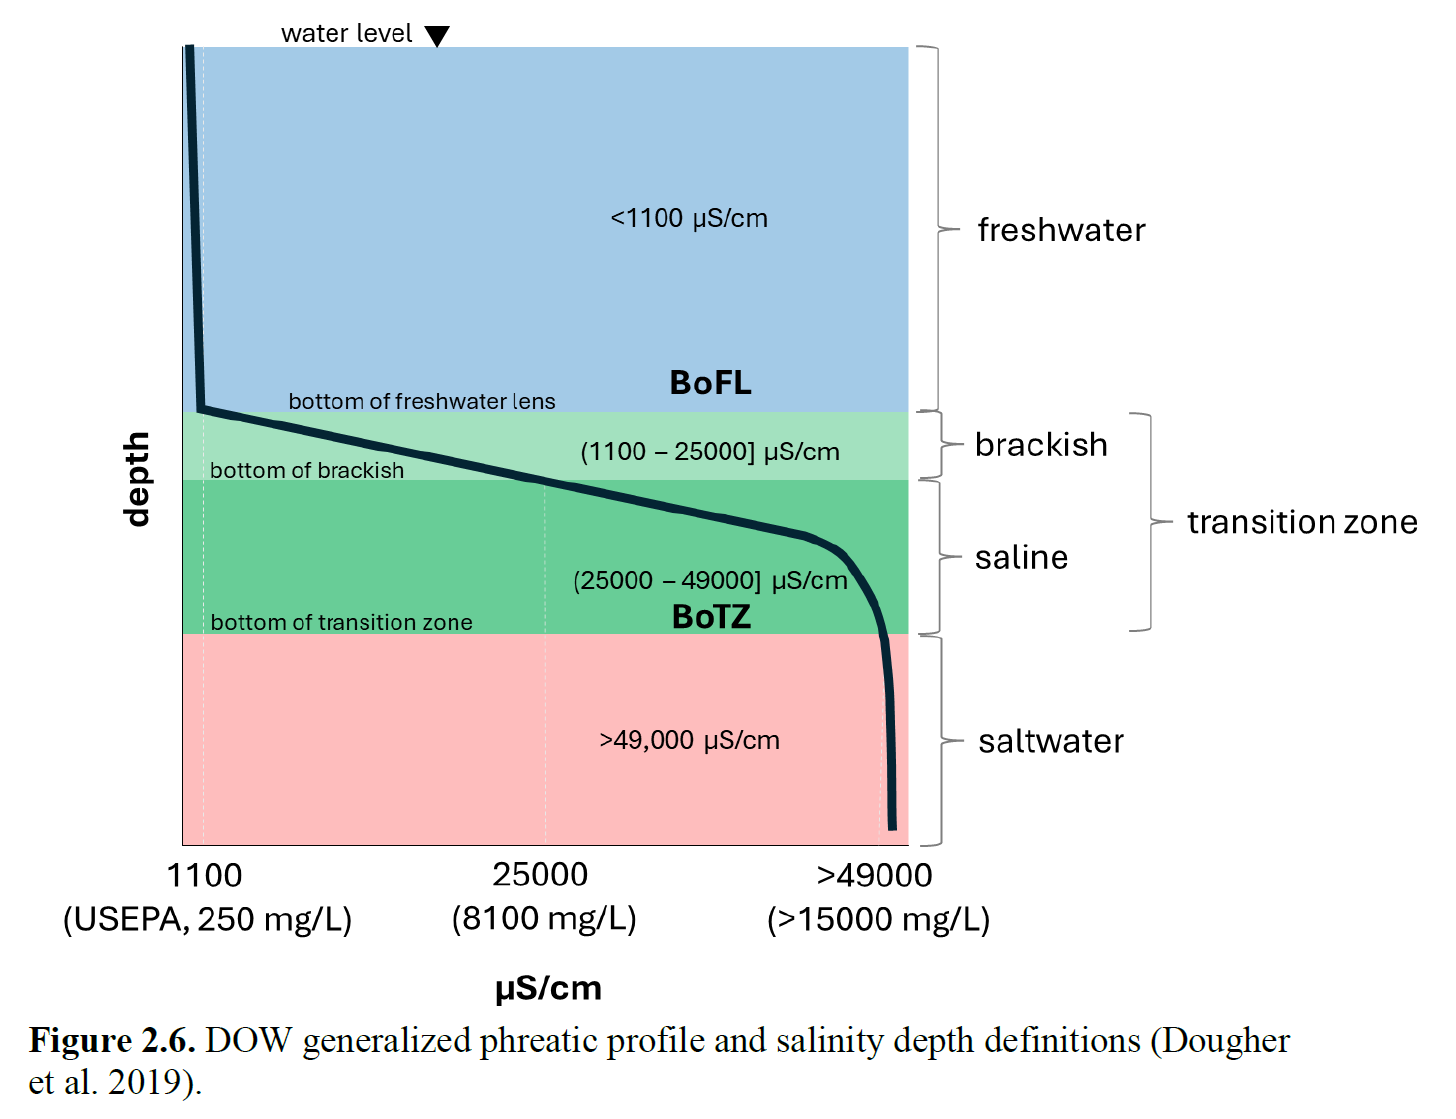
Dougher et al. (2019) defined phreatic zone interfaces as water level (WL), the bottom of the freshwater lens (BoFL), the bottom of the brackish layer (BoBL), and the bottom of the transition zone (BoTZ) (Figure 2.6). Based on CTD profiles from the Tomhom Aquifer DOWs, including EX-7, EX-10, and GHURA-Dededo from 2000 to 2016, a generalized CTD profile was developed and used to create the time-series analysis in Dougher et al.’s study. The BoFL threshold was adopted from Simard et al. (2015), who used a linear trend of conductivity and chloride data to estimate that the 250 mg/L chloride concentration, corresponding to the USEPA secondary drinking water standard for chloride, was approximately 1,100 μS/cm.
Hydrologic Analysis of DOWs
In this study, the bottom of the freshwater lens (BoFL) is defined as the depth corresponding to a chloride concentration of 250 mg/L, based on the USEPA National Secondary Drinking Water Regulation (NSDWR) for chloride.
Because conductivity varies with temperature, the conductivity corresponding to 250 mg/L chloride was determined using a conductivity–temperature experiment described in Appendix C. Although the NSDWR is an aesthetic guideline based on taste rather than a health-based standard, it provides a consistent definition of freshwater for this analysis. This chloride-based definition allows freshwater lens thickness to be compared among DOWs under different hydrologic conditions, including periods of abundant recharge and prolonged drought.
The brackish pivot identified on a salinity profile provides an additional reference point for interpreting the transition from freshwater to saltwater. Because it is not defined by a fixed conductivity threshold, the brackish pivot varies by collection date and requires manual inspection of each salinity profile to identify the point of inflection (Appendix E).
Data Sources
This study integrates hydrologic, geologic, and climatic datasets from multiple sources to evaluate changes in freshwater lens thickness. These datasets include DOW CTD data from the USGS GeoLog Locator, rainfall records from the USGS Water Data for the Nation (WDFN) and NOAA NWS Online Weather Data websites, the ENSO Oceanic Niño Index (ONI) from the NWS Climate Prediction Center, sea-level records from the University of Hawai’i Sea Level Center, and borehole data from the GHS Borehole Database. Appendix A contains tables with direct links to the data sources for each DOW.
Methods
Chapter 3 describes the methods used to address the first two specific objectives: (1) compilation and organization of hydrologic, climatic, and hydrogeologic data, and (2) analysis of the freshwater lens through hydrologic, geologic, and statistical approaches.
Hydrologic Analysis
Phreatic hydrographs (Linsley et al., 1982) were created for each DOW to examine variations in freshwater lens response to climatic and meteorologic conditions. The analysis incorporated Oceanic Niño Index (ONI), rainfall, and sea-level. As discussed in the previous chapter, ENSO, rainfall, and sea level influence the phreatic salinity profile.
Deep Observation Wells (DOWs)
A temperature–conductivity analysis was conducted to determine the conductivity value corresponding to the 250 mg/L chloride threshold to define the bottom of the freshwater lens (BoFL). An equation relating conductivity to temperature was developed from the conductivity–temperature experiment described in Appendix C. A Visual Basic for Applications (VBA) code was then created in Microsoft Excel to apply this equation to each CTD collection date for each DOW (Appendix D).
CTD data for each DOW were processed and organized in Excel. Each spreadsheet included the profile date (2000–2024), water level (WL), updated BoFL, previous BoFL defined at 1100 μS/cm, bottom of the brackish layer (BoBL) at 25,000 μS/cm, bottom of the transition zone (BoTZ) at 49,000 μS/cm, Ghyben-Herzberg (GH) 40:1 ratio, freshwater lens thickness, and freshwater lens thickness statistics (Appendix B). Some DOW spreadsheets also included the elevation of the shallow brackish layer (“Shallow Con 250”) and brackish pivot depth (Appendix E). Linear interpolation was used to estimate BoFL, BoBL, and BoTZ depths for each CTD profile collection date.
The calculated depths were plotted on multi-axis phreatic hydrographs, with color coding applied to distinguish phreatic interfaces on the primary axis (Dougher et al., 2019). These graphs illustrated changes in water level, freshwater lens thickness, and transition zone over time. Daily rainfall data from the National Weather Service (NWS) and the Dededo USGS rain gages from 2000 to 2024 were plotted on the secondary axis. Major typhoon events were also labeled and rainfall from the two rain gages was differentiated by color.
Climate, Rainfall, and Sea Level
ONI data were obtained from the historical ENSO record and organized by month and year from 2000 to 2024. Because ONI values are reported as three-month running means, the central month of each three-month period was used as the representative month. For example, DJF, representing December–January–February, was assigned to January. Positive and negative ONI values were separated and color coded to indicate the relative strength of El Niño and La Niña conditions.
Rainfall records from the rain gages were compiled by date and rainfall (in). Seasonal rainfall data from the NWS rain gage were analyzed to identify the wet and dry seasons. These values were graphed and categorized using color-coded rainfall thresholds. Reference lines representing average annual rainfall of 90 and 100 inches were added and total annual rainfall was plotted in the background to provide context for seasonal variability.
Daily averaged sea-level from the Apra Harbor Tide Gage were compiled and aligned by date. These records were integrated into the hydrographs to examine potential relationships between sea-level variability and changes in freshwater lens position.
Cross Section Geologic Analysis
Cross section diagrams were constructed to examine the geologic formations surrounding the DOWs and to assess their influence on freshwater lens response. A 2020 digital elevation model (DEM) of Guam and a georeferenced geologic map of Guam (Tracey et al., 1964) were used in ESRI ArcGIS Pro, with hillshade and a basemap added for topographic texture and reference.
DOW locations were plotted as points, and polylines were drawn to intersect the wells. Cross section lines were converted to raster layers using Polyline to Raster (Conversion Tools), then converted to points using Raster to Point (Conversion Tools). The Add XY Coordinates tool (Data Management Tools) was used to assign positional information to each point. Elevation values from the DEM, along with basement topography depth (b), hydraulic head (h), and lens thickness (z), were extracted and assigned to each point using Extract Multi Values to Points (Spatial Analyst Tools) (Gingerich, 2013; Vann, 2014; Habana and Jenson, 2018). The resulting attribute table was exported as a .csv file for analysis in Excel.
Scatter plots were then constructed, with distance along the cross section on the x-axis and elevation on the y-axis. Borehole logs from the NGLA Borehole Database (Bendixson et al., 2013) and the General Geology of Guam report (Tracey et al., 1964) were used to support subsurface interpretations, specifically formation transitions, cavities, and borehole depths.
Analysis of Lens Thickness and Annual Rainfall
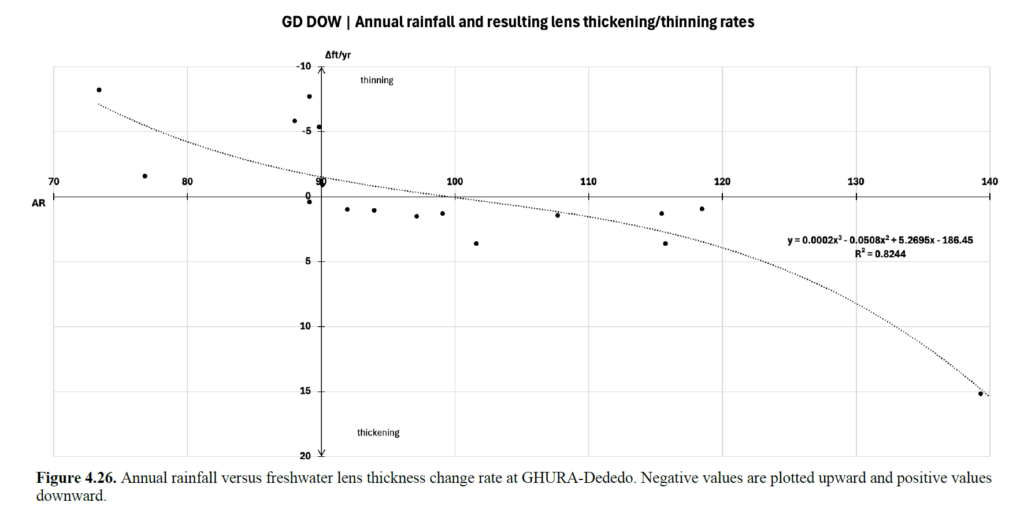
A graph was created in Excel for GHURA-Dededo to examine the relationship between annual rainfall and freshwater lens thickness rate of change. The graph compared annual rainfall with the rate of lens thickness change (ft/yr). Annual rainfall was plotted on the x-axis and the rate of change on the y-axis, which was inverted so that thinning appeared at the top and thickening at the bottom.
Frequency Distribution of Phreatic Interfaces
Histograms were constructed for each DOW to evaluate the frequency distribution of water level depth, bottom of the freshwater lens (BoFL), bottom of the transition zone (BoTZ), and brackish pivot. These histograms were used to illustrate the range and distribution of phreatic transitions at each site.
The average depths of the BoFL and brackish pivots were also calculated. The range of depths within two standard deviations (2σ) from the mean was evaluated and displayed on the graphs. The Guam Environmental Protection Agency (GEPA) maximum well-depth regulation of 25 to 40 ft was included for reference (Mink, 1976).
Results and Discussion
Results are presented by basin from north to south: Machanao, Tomhom, Hagåtña, and Pågu. Within each basin, deep observation well (DOW) phreatic hydrographs are interpreted alongside supporting hydrologic factors to evaluate freshwater lens response and phreatic zone dynamics. To support hydrograph interpretations, map cross sections are used to provide hydrogeologic insight.
Phreatic Hydrographs of DOWs
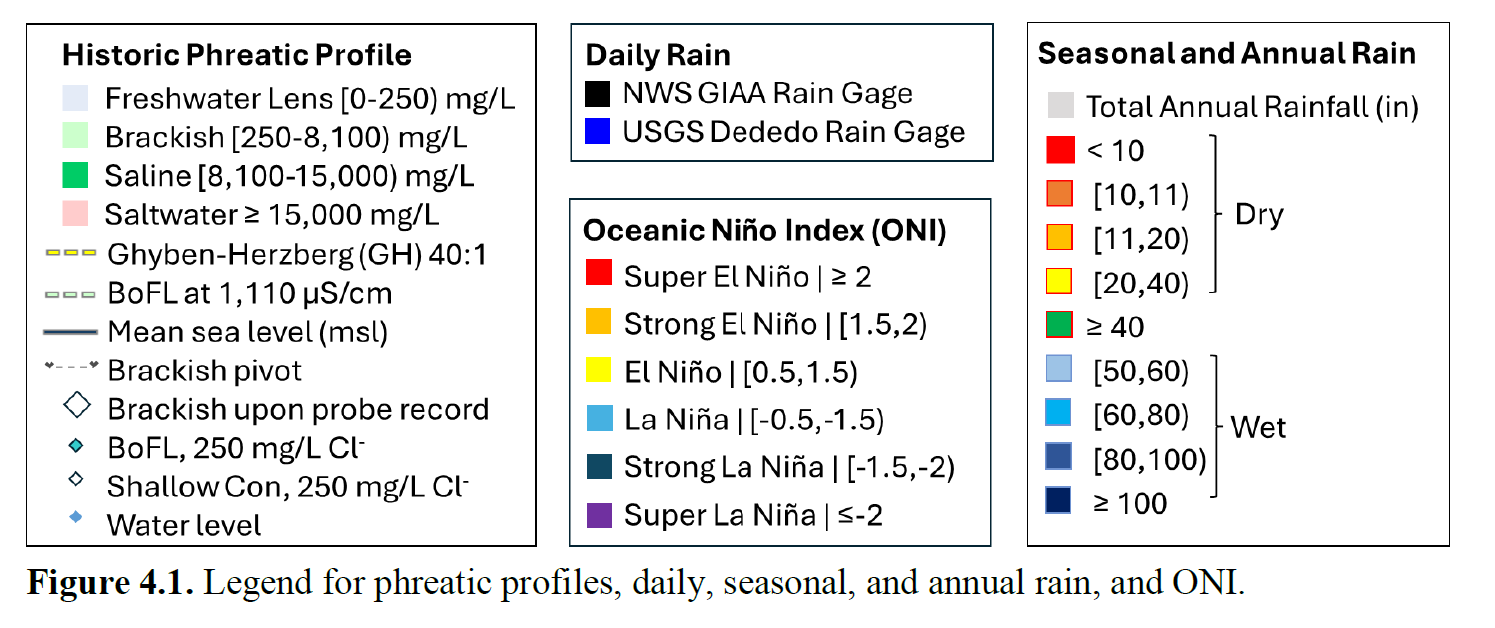
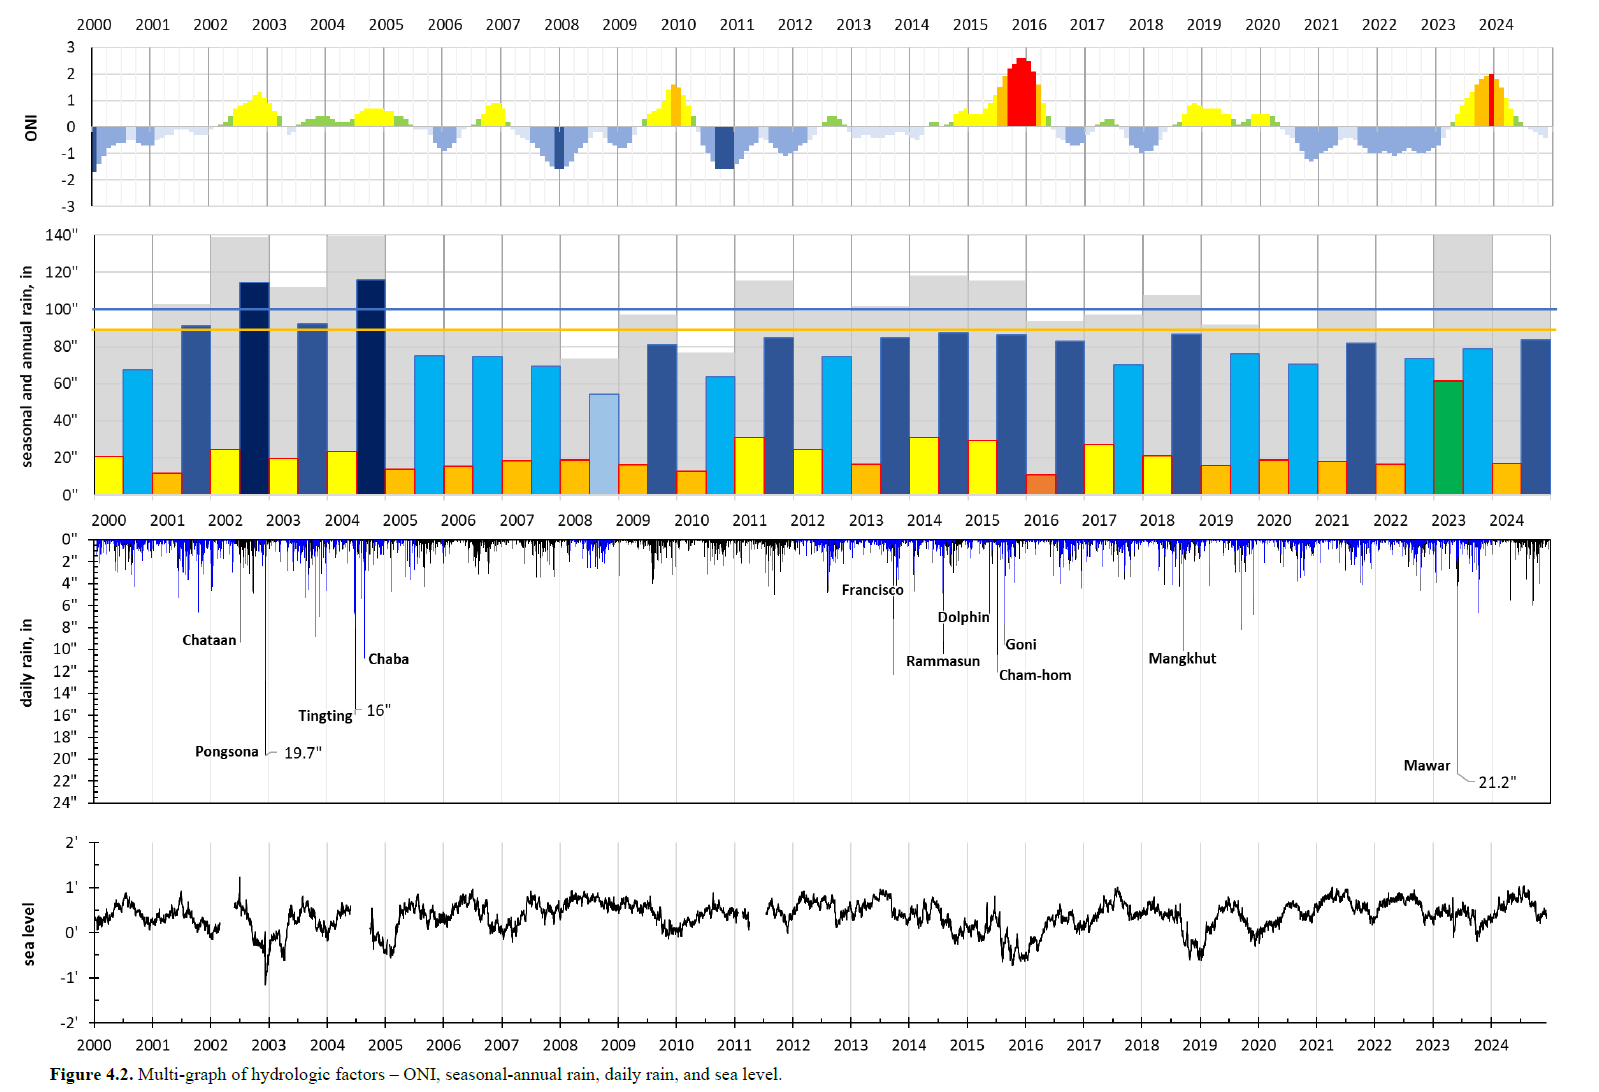
The layout of the nine DOW hydrographs includes the ENSO index, rainfall, sea level, and historic phreatic profiles from 2000 to 2024. As discussed in Chapter 2, freshwater lens dynamics may reflect three significant hydrologic factors. Each phreatic hydrograph was evaluated with the Oceanic Niño Index (ONI) to observe El Niño and La Niña phases, rainfall shown as annual, seasonal, and daily values, and daily average sea level. Daily rainfall data were obtained from the Dededo and NWS gages, while seasonal and annual rainfall were derived from NWS records. Figure 4.1 provides the legend and symbology used for the ONI, rainfall, and historic phreatic profiles.
The hydrologic factors, including climatic, meteoric, and tidal factors, were aligned annually. Figure 4.2 shows the hydrologic factor graphs that were used in each DOW phreatic hydrograph. From 2000 to 2024, three strong to super El Niño events occurred in 2009–2010, 2015–2016, and 2023–2024, while multiple La Niña events, including double- and triple-dip phases, were also recorded. El Niño onset and peak phases generally coincided with increased tropical cyclone activity and annual rainfall exceeding 100 in. In contrast, post-peak El Niño periods, including 2016–2017, and La Niña phases were associated with reduced rainfall, with annual rainfall often below 100 in, and prolonged drought.
In 2002, 2004, and 2023, annual rainfall reached about 140 in. However, rainfall varied seasonally. The years 2002 and 2004 had wetter wet seasons, exceeding 100 in, whereas 2023 exhibited an unusually wet dry season of approximately 60 in. Thirteen years recorded annual rainfall below 100 in, including eight years below 90 in. These years corresponded to the extreme drought period from 2005 to 2011, which meteorologist Dr. Mark Lander referred to as “The Big Nothing” (Dougher, 2019), as well as the post-El Niño prolonged dry seasons in 2016 and 2020–2022. The 2005–2011 dry period is notable because regular to strong El Niño events were followed by regular to strong La Niña events. During this period, annual rainfall reached record lows in 2008 and 2010, with both years recording less than 80 in.
Daily rainfall records show several typhoons that produced intense rainfall on Guam. Pongsona in 2002, Tingting in 2004, and Mawar in 2023 each brought more than 15 in of rain in one day, with a maximum of 21.2 in recorded during Mawar. In 2004, the combined effects of Tingting and Chaba produced approximately 27 in of rainfall. Daily average sea level fluctuated within approximately ±2 ft. Periods of lowered sea level generally occurred during peak El Niño, whereas La Niña was associated with rising sea level.
The following subsections discuss the dynamics of the phreatic hydrographs responding to the significant hydrologic factors mentioned above. Each subsection is organized by aquifer basins in order: Machanao, Tomhom, Hagåtña, and Pågu. All DOWs had no data during the pandemic years. CTD measurements collected prior to 2004 are from an earlier phase of data collection, before techniques were refined that year.
Machanao Aquifer Basin
EX-8
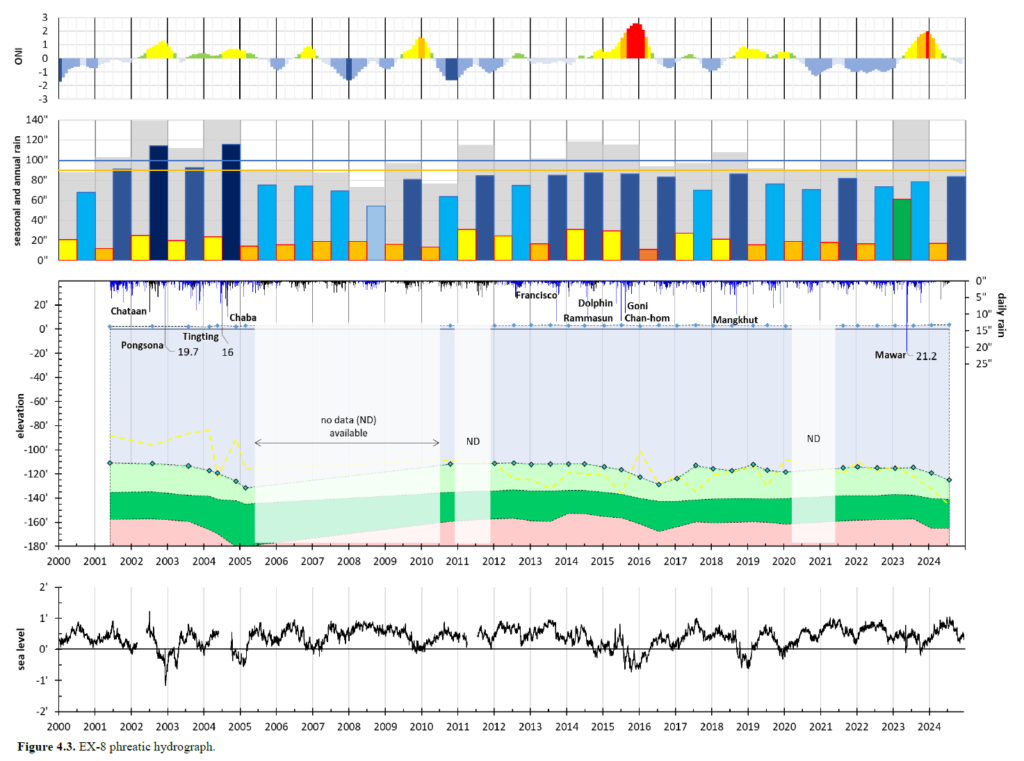
EX-8 contains the largest gaps in CTD records, with no data (ND) during the dry period from 2005 to 2010, no data in 2011, and no data during the pandemic years from 2020 to 2021. The year 2004 had the most CTD collections, with seven profiles collected almost monthly after May, followed by seven years of quarterly measurements. Figure 4.3 shows freshwater lens thickness at EX-8 ranging from 113 ft in May 2001 to 134.5 ft in February 2005, with an average thickness of 119.4 ft and a mode of 115 ft. EX-8 is located approximately 1.7 miles inland, and tidal influence appears minimal.
In this DOW, lens thickening generally followed major recharge events associated with typhoons, with maximum thickness commonly reached about a year later. From an annual rainfall perspective, with the exception of Typhoon Pongsona, annual rainfall greater than 110 inches tended to be followed by a lens-thickness response. This was observed in 2004, 2014‑2015, and 2023, when lens thickness exceeded 128 ft, which is more than 9 ft above the average. In these cases, years with annual rainfall greater than 110 inches also occurred during the onset of El Niño, when typhoons contributed more than 10 inches of rainfall to the island. Following Typhoon Chan-hom in July 2015, thickness increased slightly within days by 2.4 ft, but the thickest record of approximately 132 ft occurred about one year later, with an 11.9 ft increase. Following Typhoon Mawar in 2023, thickness reached 128.7 ft, an 11.1 ft increase from the previous record.
For Typhoon Pongsona in 2002 and Typhoon Mangkhut in 2018, CTD measurements were collected about one year after the storms and may not have captured short-term recharge responses. Also, CTD measurements were refined after 2004 (Dougher, 2019). Thus, the freshwater lens responded quite significantly after three typhoon related recharge periods, which is easily observed in the graph. The available data show that, most of the time, the BoFL remained between approximately -110 and -115 ft. It is unfortunate that the driest years in the record, from 2005 to 2010, have no data, which may have provided insight into how thin this part of the aquifer became, as observed in other DOWs.
The water table response can take up to a month to return to its normal level, whereas the freshwater lens response in this DOW appears to take about a year to reach maximum thickness and perhaps another year to return to its frequent level. The delayed thickening observed is consistent with the concept that recharge responses in the NGLA may occur over time rather than immediately after rainfall. However, freshwater lens thickness differs from hydraulic head because it reflects not only water table response, but also freshwater accumulation, saltwater displacement, and possible contributions from upgradient freshwater and suprabasal waters. The amount of recharge that actually enters the aquifer and contributes to lens thickening is not easily quantifiable, since some recharge may also discharge from the aquifer.
Tomhom Aquifer Basin
EX-10
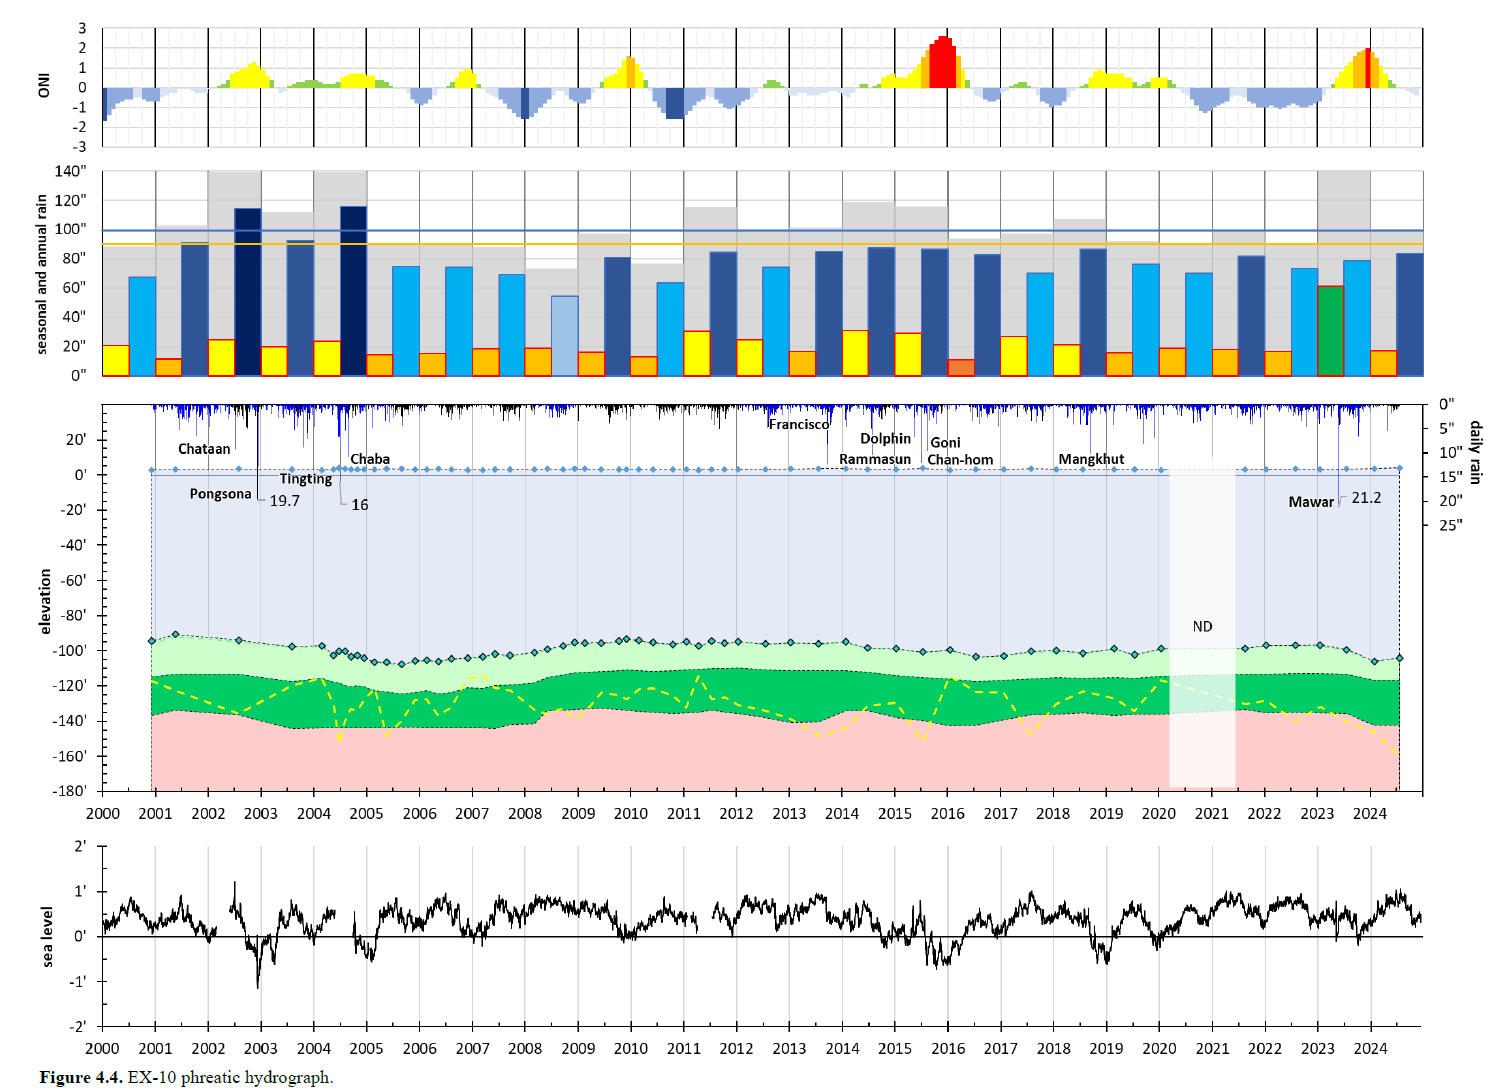
EX-10 appears to be the least responsive DOW, with lens thickening less than 10 ft following major storms, including Typhoons Tingting and Chaba in 2004 and Typhoon Mawar in 2023. Figure 4.4 shows freshwater lens thickness ranging from a minimum of 93.8 ft in May 2001 to a maximum of 111.2 ft in August 2005, a difference of about 17 ft. The average thickness was 102.6 ft, with bimodal thicknesses of 99 ft and 102 ft. Elevation-wise, the BoFL was typically around -95 ft. Although EX-10 is located relatively close to the coast, approximately 1.6 mi inland, tidal influence appears minimal.
At this DOW, annual rainfall greater than 100 in did not produce a large response, although the lens appeared to show a slightly stronger response during years with about 140 in of annual rainfall. After Typhoon Pongsona in 2002, lens thickness increased by approximately 3.5 ft and by approximately 3 ft after Typhoons Tingting and Chaba in 2004. Seven months after Typhoon Mawar in 2023, lens thickness increased by 6.7 ft.
During the drought period, the freshwater lens did not thin significantly. Thickness decreased from February 2005 to February 2009 at approximately 2.8 ft/yr, then remained relatively steady from February 2009 to January 2011, varying within only 2.8 ft. Another decrease occurred during the post-peak El Niño period from 2016 to 2017, when thickness decreased by 2.4 ft.
Transition zone thickness ranged from 34 ft to 46.7 ft, with an average thickness of 39.3 ft, maintaining a relatively similar thickness throughout the record. Overall, the freshwater lens at EX-10 did not thin significantly during prolonged drought and showed only small increases following heavy rainfall events.
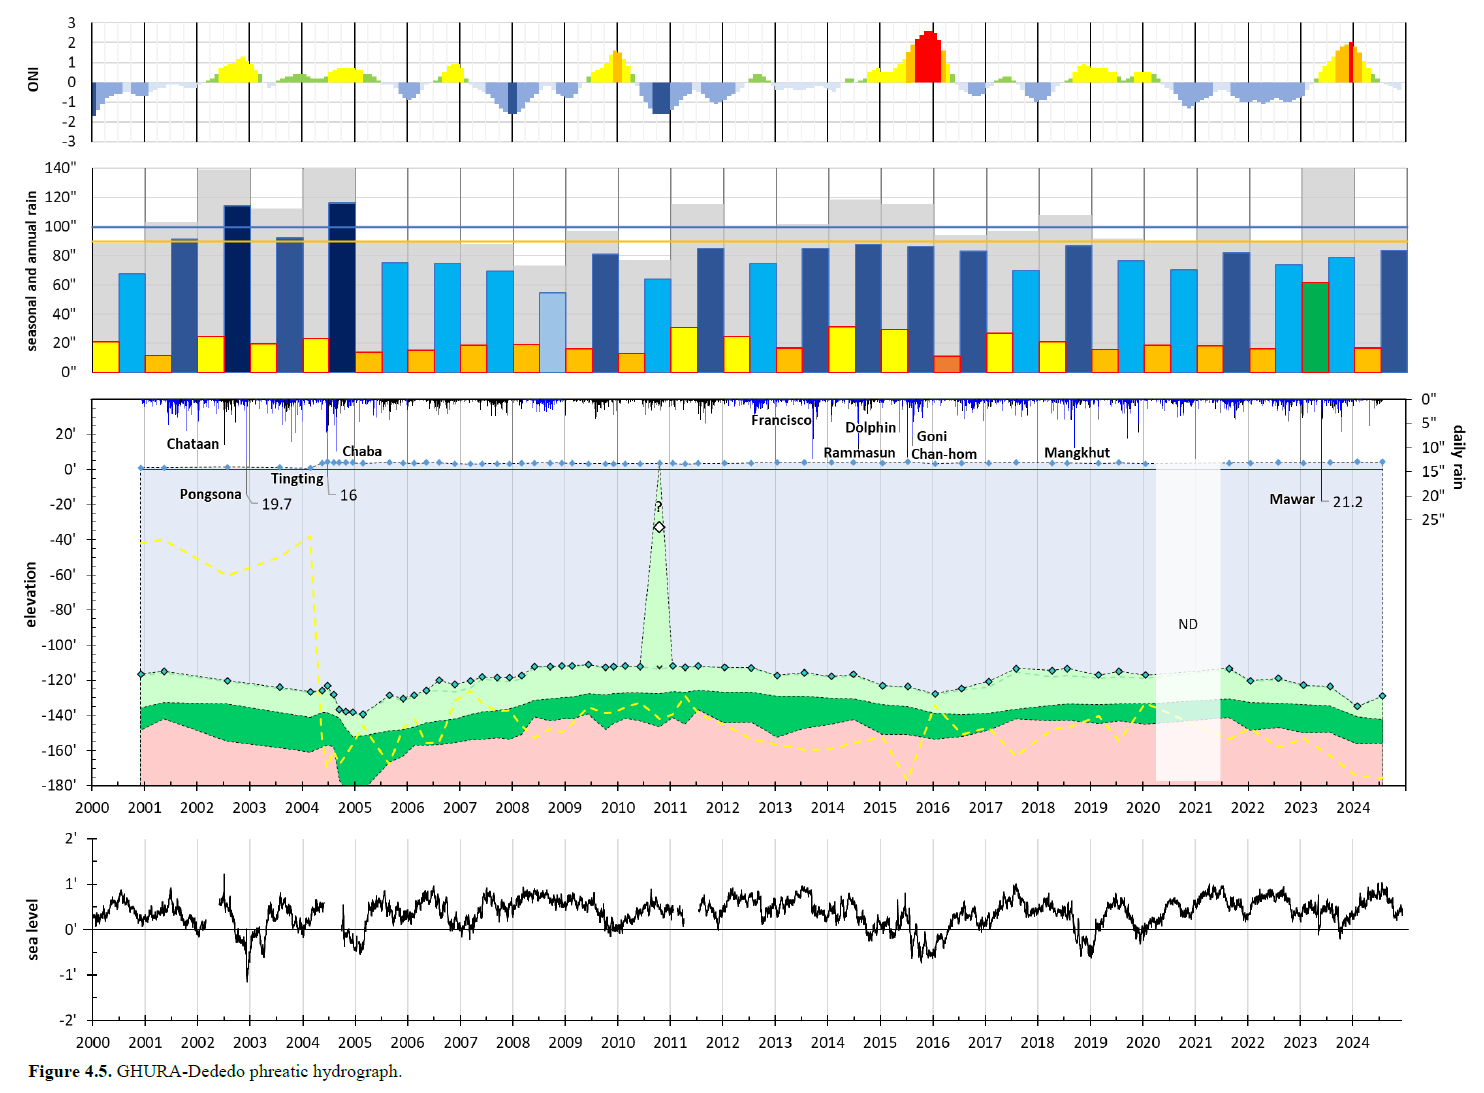
GHURA-Dededo
GHURA-Dededo appears to be the third most responsive of the Barrigada Limestone observation wells. Figure 4.5 shows freshwater lens thickness ranging from 36.5 ft in October 2010 to 142.9 ft in February 2005, with an average thickness of 122.2 ft and a mode of 116 ft. GHURA-Dededo is the most inland DOW, located about 3 mi from the coast, and tidal influence appears to be minimal (c.f. Wuerch et al., 2007). With the exception of Typhoon Pongsona, this DOW appears to respond to annual rainfall greater than 100 in, which usually led to lens thickening. The lens thickened from 2012 to 2016 at approximately 4.1 ft/yr, coinciding with several typhoon-related recharge events from 2013 to 2015, including Francisco through Goni.
When annual rainfall reached approximately 140 in, GHURA-Dededo appeared to have a stronger response, with lens thickness usually increasing to more than 130 ft about 6 months after typhoons. The 2004 typhoons increased lens thickness by up to 17 ft, with the lens reaching its maximum thickness of approximately 143 ft. A similar 6-month lag to maximum thickness occurred after Typhoon Chan-hom. After Typhoon Mawar in 2023, the lens took about 8 months to reach its maximum thickness.
During the drought period, when annual rainfall was less than 90 in, the lens usually thinned. It took about 4.5 years for the lens to reach its minimum thickness. From February 2005 to June 2008, the lens thinned at approximately 8.3 ft/yr. From January 2016 to July 2017, the lens thinned by approximately 6 ft during the post-El Niño period. The lens generally does not appear to thin below 114 ft, even during dry periods, with the exception of October 2010, when the BoFL was 33 ft below msl.
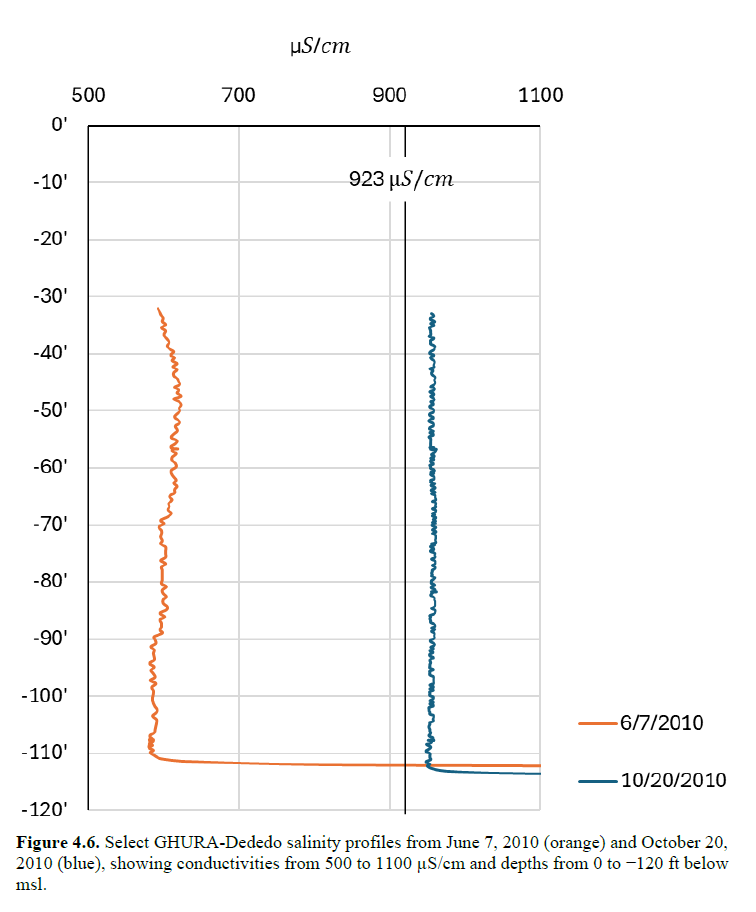
Compared to the previous profile in June 2010, the October 2010 conductivity profile shows slightly elevated conductivity at the start of the probe record, with values slightly exceeding the 250 mg/L chloride threshold of 923 μS/cm (Figure 4.6). This slight shift in concentration indicates that this record had a brackish lens. The year 2010 was the second driest year shown in the graph, with less than 77 in of annual rainfall. However, the brackish pivot remained ~113 ft below msl, and the increase in salinity may have been caused by upward diffusion of brackish water due to insignificant to no recharge. Maximum daily rainfall that year was only 3.17 in, occurring during the wet season.
When annual rainfall was about 100 in during 2008–2010, 2011–2012, and 2021–2022, the freshwater lens remained relatively steady, suggesting that rainfall near Guam’s average annual total may be enough to maintain a stable lens.
Unlike EX-10 and EX-8, the transition-zone thickness at this DOW is less stable. The transition zone ranged from 21.3 ft to 44 ft, with an average thickness of 31.1 ft. During drought, the brackish layer appears to become thicker as the freshwater lens thins, and thinner as the freshwater lens thickens. The BoTZ is also less smooth than in EX-10 and EX-8. During effective recharge, the saline layer appears to thicken, whereas during dry periods, the BoTZ appears more jagged.
Overall, GHURA-Dededo exhibits a generally thick and stable freshwater lens, but with a stronger response to both recharge and drought compared to EX-10 and EX-8. The lens usually remained thicker than 114 ft, except during the October 2010 profile, when shallow brackish water was observed near the top of the profile.
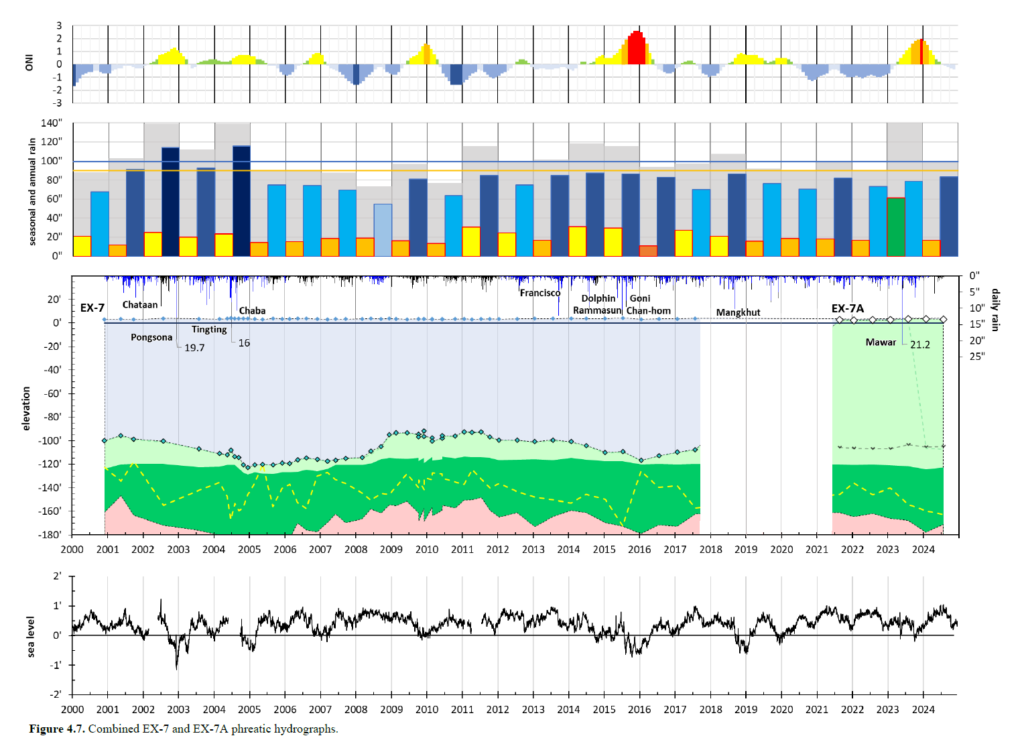
EX-7
EX-7, located in the Tomhom Aquifer Basin, is the most responsive Barrigada Limestone DOW and shows a flashy response in both the BoFL and BoTZ. Unfortunately, the well was closed, and the record only extends to 2017 (see Chapter 2). Figure 4.7 shows EX-7 freshwater lens thickness ranging from 95.5 ft in December 2009 to 126.3 ft in December 2004, with an average thickness of 109.4 ft and a mode of 103 ft.
Unlike EX-8 and EX-10, EX-7 showed freshwater lens thickening when annual rainfall was greater than 100 in. From 2014 to 2016, lens thickness increased following five typhoons, reaching 119.8 ft. Maximum thickening following Typhoon Chan-hom in 2015 occurred about six months after the storm. The lens appears to have a stronger response when annual rainfall exceeds 140 in. Following Typhoon Pongsona in 2002, the BoFL reached 106.9 ft below msl, while after Typhoons Tingting and Chaba in 2004, the BoFL deepened to 122.6 ft below msl.
It took about four years for the lens to reach its minimum thickness following the dry period from 2005 to 2007. The lens thinned gradually at first, then more rapidly in 2008. That year, when annual rainfall was below 80 in, the lens appeared to thin rapidly. Between March 2008 and February 2009, thickness decreased by about 22 ft. From 2009 to 2011, thickness remained relatively steady within about 8 ft. From 2016 to 2017, the lens thinned by about 6 ft during the post-peak El Niño drought.
Because EX-7 is the second closest DOW to the coastline (~1.21 mi inland), tidal signals may have a stronger influence on lens position than at more inland wells. Several periods of lens thickening also coincided with sea-level drops, including around 2005, 2010, and 2016.
The transition zone is thicker compared to the other DOWs in the Barrigada Limestone, ranging from 45.8 ft in June 2007 to 131.6 ft in September 2004, with an average thickness of 64.2 ft. As the BoFL deepened, the brackish transition layer appears to be displaced by freshwater, while the saline layer below thickens. Although the transition zone interfaces responded erratically, the saline-brackish interface appeared to respond less strongly.
EX-7A
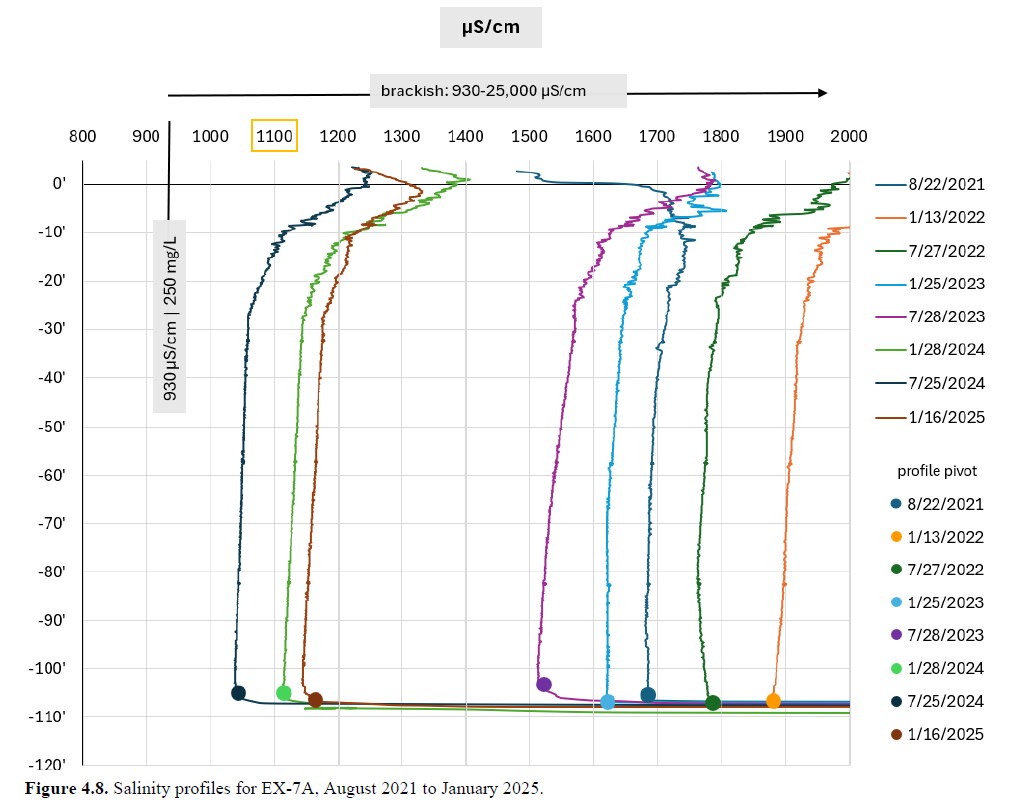
EX-7A, a newer DOW constructed in 2019 to replace EX-7 due to road widening, shows a different response to recharge. Based on the USEPA National Secondary Drinking Water Regulation (NSDWR) threshold of 250 mg/L chloride, salinity profiles from EX-7A show that the well is brackish immediately upon probe entry for each collection date (Figure 4.8), with conductivity values slightly exceeding the 930 μS/cm BoFL threshold.
However, the brackish pivot occurs at elevations similar to the BoFLs observed in EX-7, ranging from 103.32 to 107.01 ft below msl, with an average depth of about 105 ft below msl (Figure 4.7). The brackish lens at EX-7A may reflect upward diffusion of brackish water during reduced freshwater recharge.
EX-6
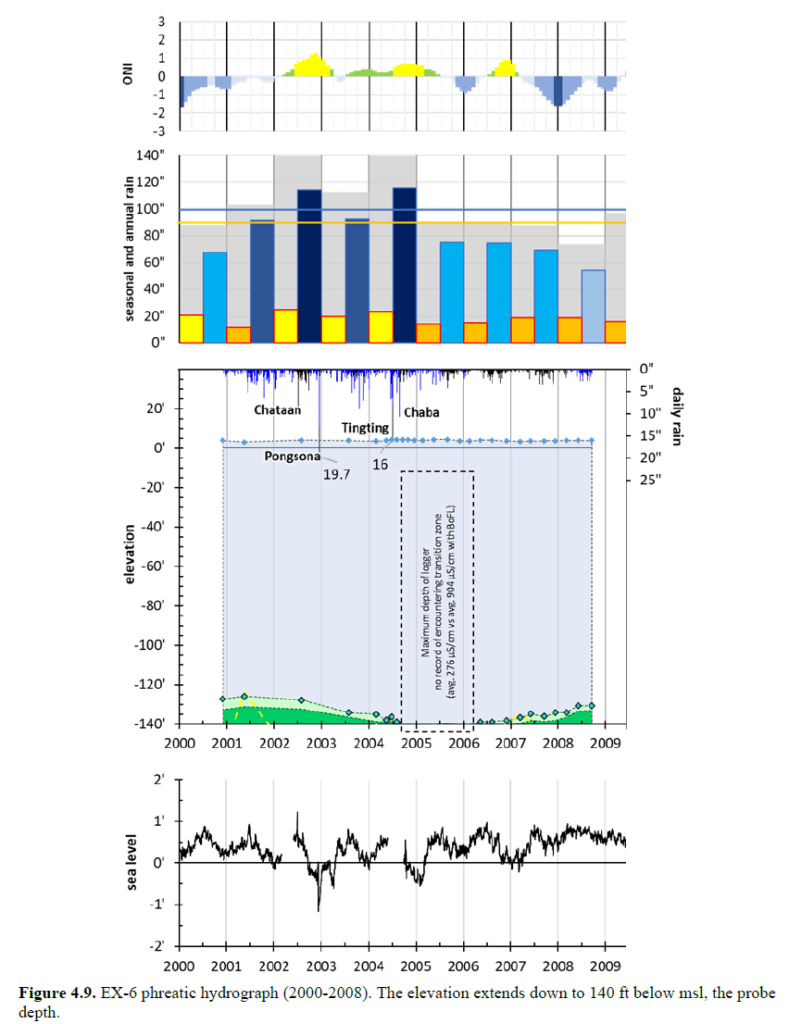
EX-6 records the thickest lens of all Barrigada Limestone DOWs, with the lens extending beyond the maximum depth of the logger after the wet period of 2004. Figure 4.9 shows that the logger did not reach saltwater, and from September 2004 to February 2006, the probe did not reach the BoFL.
EX-6 is located approximately 2.19 mi inland, and freshwater lens ranged from 129 ft in May 2001 to 143 ft in May 2006. Average lens thickness and mode was 138 ft. This DOW responded to years with 140 in of annual rainfall. Following Typhoon Pongsona in 2002, lens thickness increased to about 138 ft by August 2003. USGS collected CTD measurements two days before Typhoon Tingting on June 27, 2004, when the lens was 140.8 ft thick. The next measurement, collected on August 4, 2004, recorded a 2.1-ft increase in thickness. Following Typhoon Chaba on August 22, 2004, the next collection date on September 16, 2004, did not capture the BoFL, suggesting that the freshwater lens thickened beyond the depth of the DOW.
The DOW response to the dry period was not completely captured. However, from 2006 to 2008, when annual rainfall was below 100 in, freshwater lens thickness decreased at approximately 3.6 ft/yr.
The transition zone at EX-6 is thinner compared to the other Barrigada Limestone DOWs. The brackish zone appears to thin as the freshwater lens thickens, while the BoTZ was not captured throughout the record.
Overall, despite the short period of record, EX-6 provides valuable insight into site response to recharge and drought. However, the DOW was likely not drilled deep enough to fully capture the freshwater lens at its maximum thickness, and the record ended too early to evaluate its longer-term hydrologic behavior.
Hagåtña and Pågu Aquifer Basins
EX-9
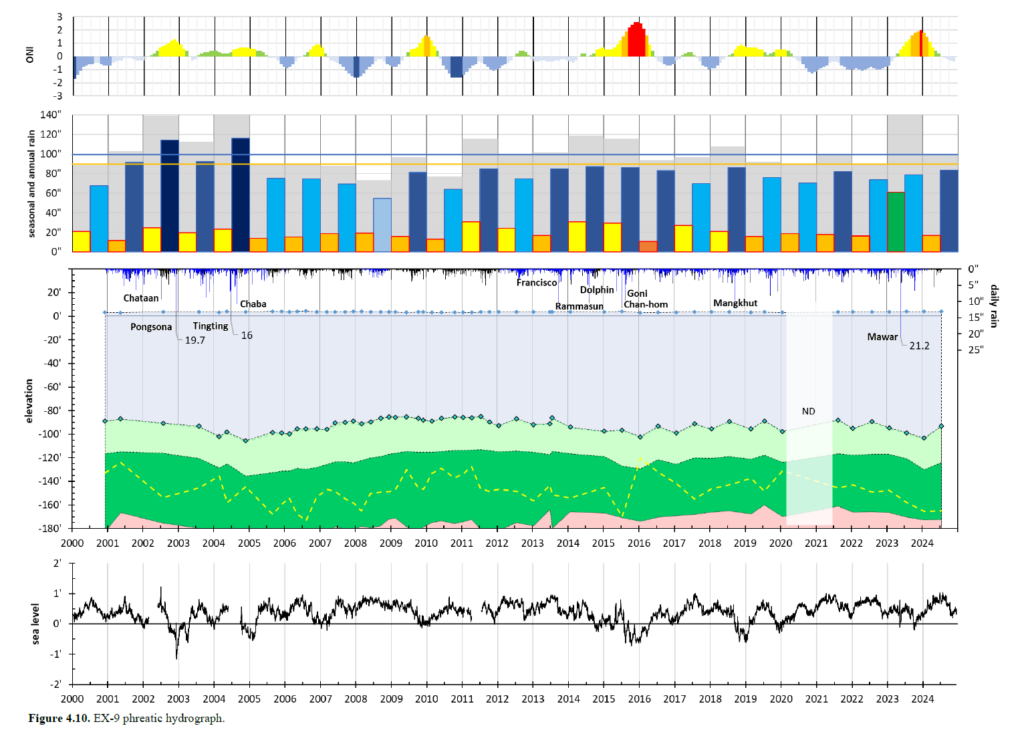
EX-9 appears to have the thinnest freshwater lens among the Barrigada Limestone DOWs. Figure 4.10 shows lens thickness ranging from 88.5 ft in July 2011 to 108.9 ft in November 2004, with an average thickness of 96 ft and a mode of 89 ft. The DOW generally thickens after the wet season and thins after the dry season. This pattern became more distinct beginning in 2012, when data collection shifted to semiannual frequency. An exception occurred in 2023, when the profile collected after the dry season showed lens thickening following Typhoon Mawar.
The DOW generally thickened after years with more than 100 in of annual rainfall. After Typhoon Francisco, lens thickness reached 93.9 ft in January 2014, a 7.6-ft increase from the previous measurement. Later typhoons, including Rammasun, Dolphin, Goni, Chan-hom, and Mangkhut, were also followed by thickening. However, the profile collected 8 days after Typhoon Chan-hom recorded a thickness of 96.6 ft, which was 0.8 ft lower than the previous measurement from January 2015.
The response to 140 in annual rainfall was much stronger, with lens thickness increasing to more than 107 ft, about 11 ft more than the average, except following Typhoon Pongsona. After the 2002 typhoon, lens thickness increased to 93.3 ft, a 2.6-ft increase from the previous measurement in July 2002. After Typhoons Tingting and Chaba, thickness increased to 105.3 ft in November 2004, a 7.1-ft increase from May 2004. After Typhoon Mawar, lens thickness increased by 4.4 ft between January and July 2023, then thickened by 4.7 ft over the next 6 months to reach its maximum thickness.
During the dry period, quarterly data show an overall decline in lens thickness, although minor wet-season rainfall led to short-term increases. It took about 6.5 years for the lens to reach its minimum thickness, with the BoFL at about 85 ft below msl. Following the peak El Niño in 2015, lens thickness decreased by 8.9 ft in 6 months, then increased by 6 ft by the next collection date in January 2017.
The transition zone is one of the thickest among the Barrigada Limestone DOWs, ranging from 69.6 ft to 96.4 ft, with an average thickness of 83.4 ft. It maintained a relatively steady thickness throughout the record, and on some dates, it was even thicker than the freshwater lens, especially during the dry period. Overall, EX-9 showed a relatively fast response to both recharge and drought, typically within less than one year. Interesting observation with the semi-annual sampling is the jagged BoFL. From 2016 to 2023, with less than a 100 in of annual rain, except the year of Mangkhut (2018), the BoFL records plots a sawtooth pattern. This DOW is hydrologically placed under the Hagåtña Aquifer Basin, but does not behave like the other two, EX-1 and EX-4, discussed next.
EX-11
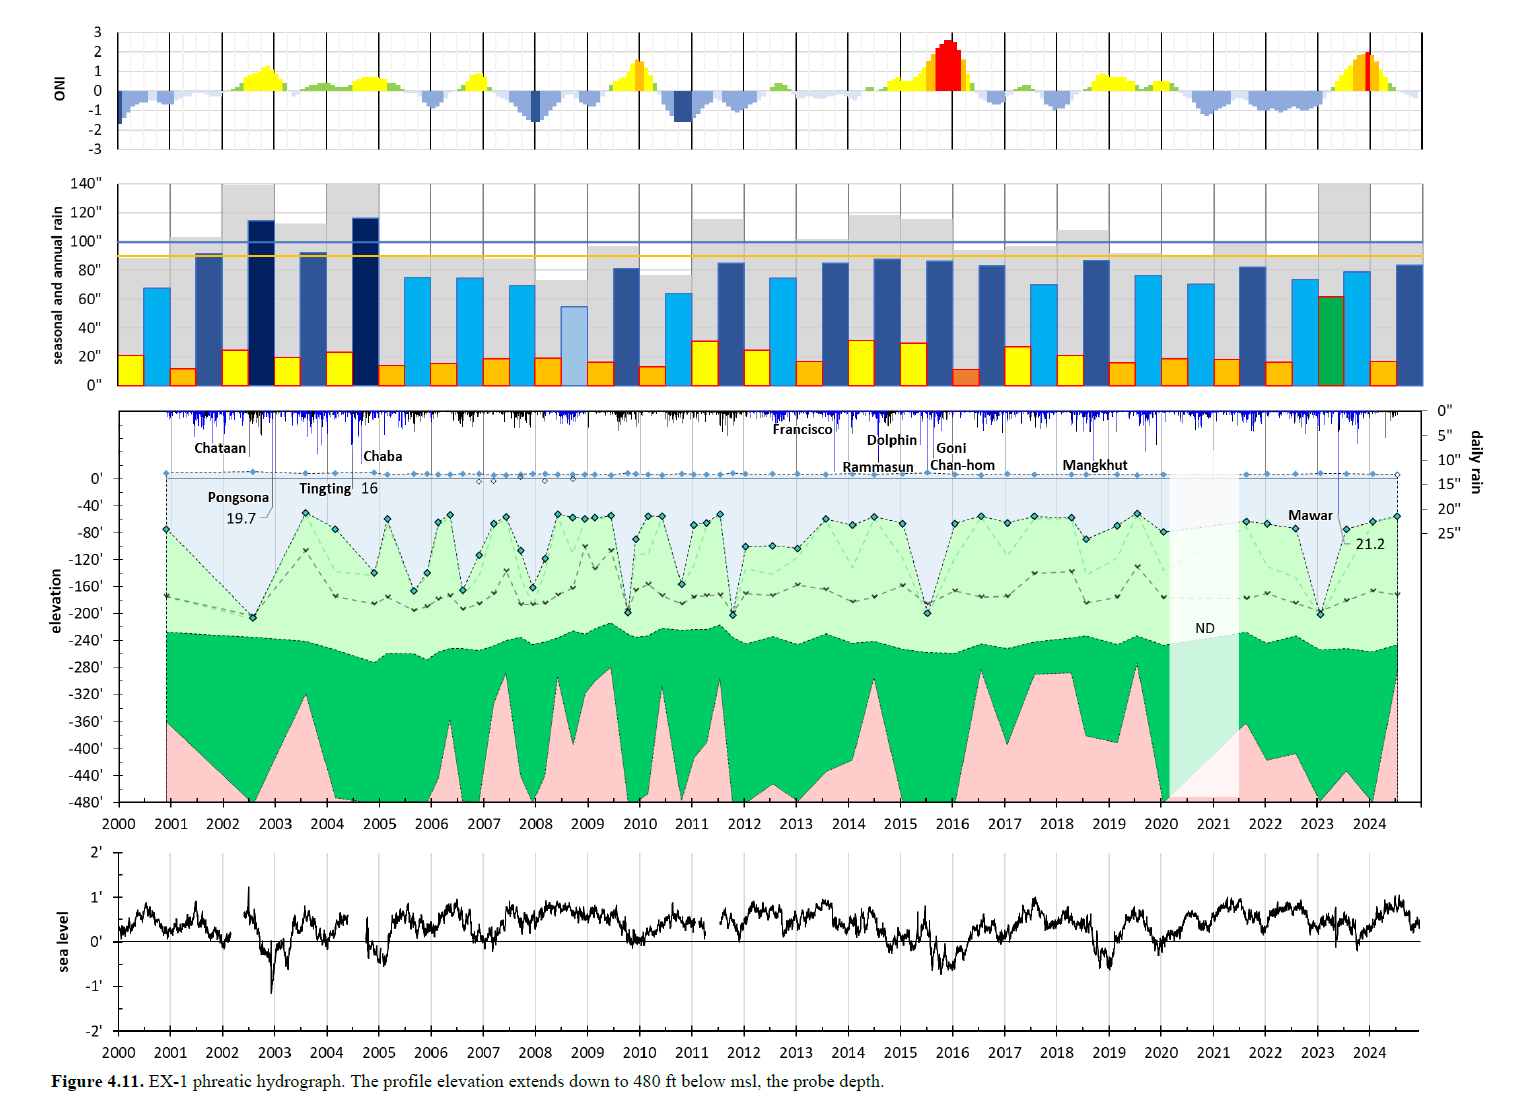
EX-1, located within the basal graben zone of the Hagåtña Basin, exhibits one of the most variable and erratic freshwater lenses. Freshwater lens thickness averaged 98 ft, with a mode of 61 ft. Figure 4.11 shows that freshwater lens thickness reached a minimum of 57 ft in July 2019 and a maximum of 217 ft in July 2002. This DOW does not consistently follow a seasonal pattern compared to the Barrigada Limestone DOWs.
The response to 140 in of annual rain was not consistent, as some records had a decrease in thickness, such as after Typhoons Pongsona and Mawar. After Typhoon Mawar, freshwater lens thickness decreased from 209.7 ft in January 2023 to 82.1 ft in July 2023, a decrease of 127.6 ft and then thinned further by 11 ft in January 2024. This rapid thinning contrasts with the thickening response observed in the Barrigada Limestone DOWs. Following Typhoons Tingting and Chaba, however, there was a thickening of the freshwater lens, with the BoFL reaching 139.1 ft below msl, although this was thinner than periods following clusters of rainfall events.
There were five times in which thickness exceeded 180 ft, especially following rainfall clusters, and not always after typhoons, with the exception of Typhoons Dolphin and Chan-hom in 2015. The rapid thickening observed after these typhoons may indicate that EX-1 responds rapidly to recharge.
During the drought period, EX-1 appears to generally follow a seasonal pattern. Freshwater lens thickness often exceeded 140 ft during the wet season and thinned to its minimum during the dry season. However, from mid-2008 to early 2009, it did not follow this seasonal pattern, and the BoFL stayed steady at an average of 56.6 ft below msl. The freshwater lens appears to not thin below 57 ft, even when annual rainfall was well below 80 in, such as in 2008 and 2010.
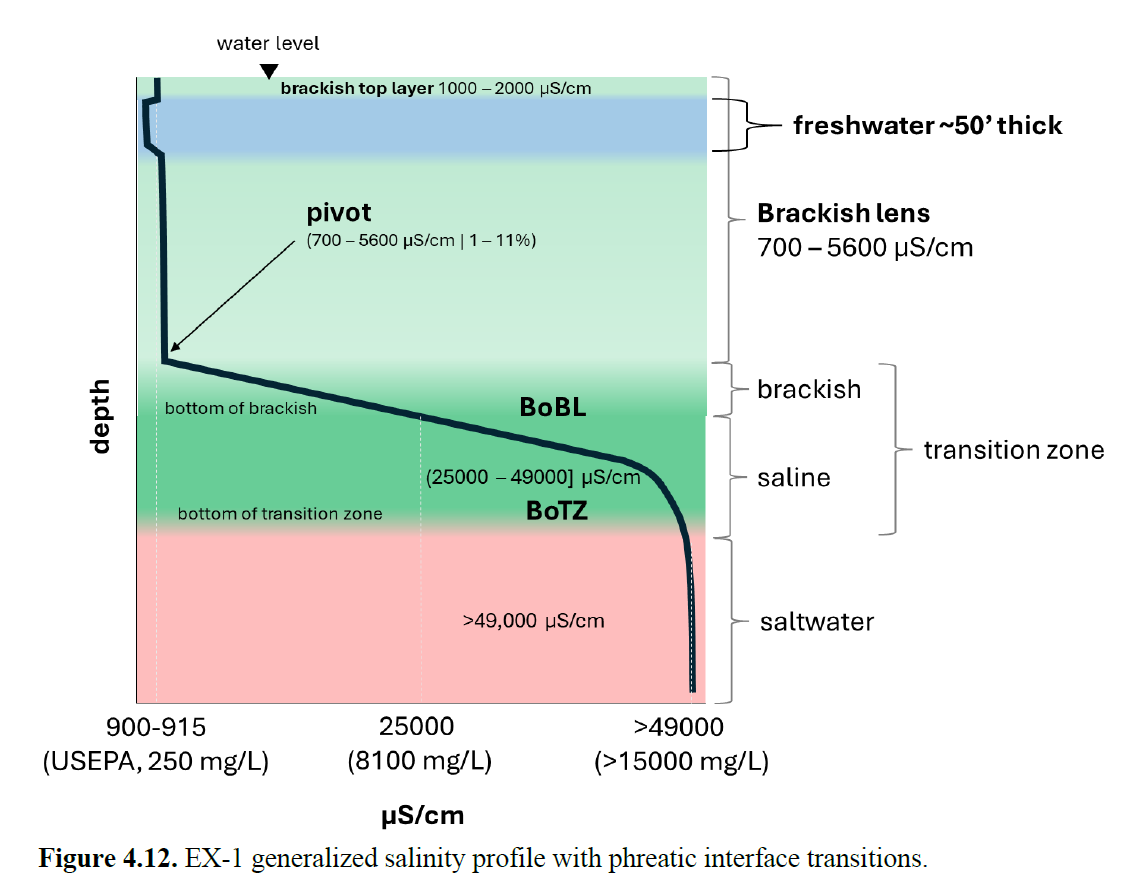
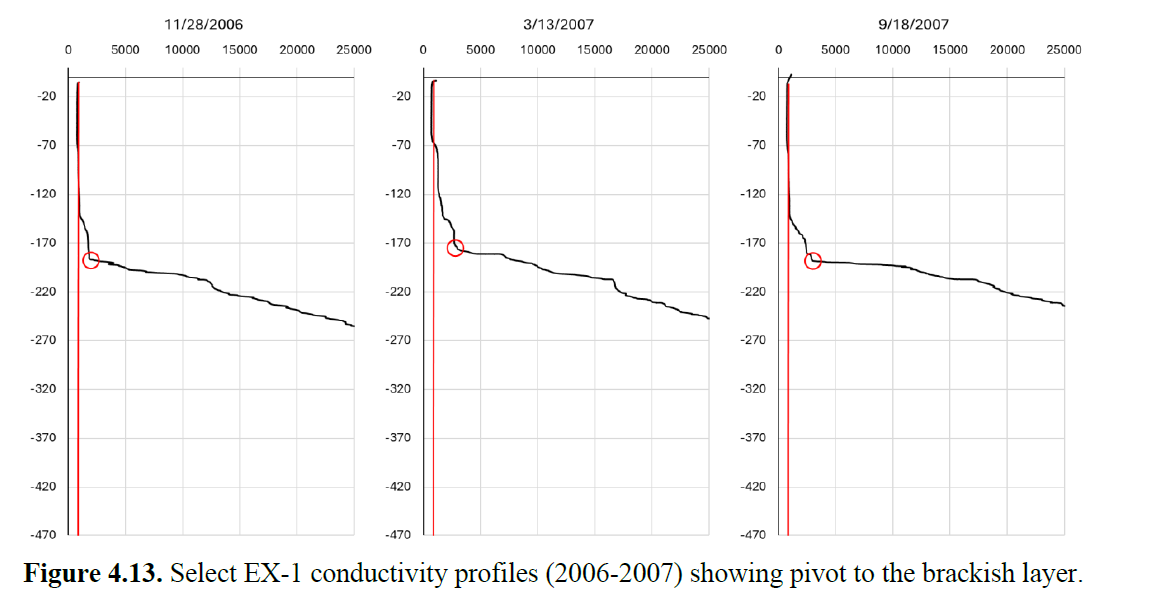
In some records, water was brackish at the start of the probe record, transitioned into freshwater, and then shifted back to brackish water at depth (Figure 4.12). A brackish pivot analysis was conducted by closely examining selected conductivity profiles to determine the pivot to brackish water (see Appendix E). The brackish pivot ranged from 700 to 5,600 μS/cm, which is less than 11% of the salinity of seawater.
In these profiles, there was a slight vertical shift to the right of the USEPA 250 mg/L chloride threshold toward brackish water, rather than a gradient-type transition to saltwater (Figure 4.13). Despite large fluctuations in freshwater lens thickness, the average brackish pivot depth was about 170 ft below msl, with about 50% of the data falling within 10 ft of this average. This reveals a stable and thick brackish lens beneath a thinner and highly variable freshwater lens.
The transition zone at EX-1 is thick, ranging from 221.8 ft to 420.2 ft, with an average thickness of 314.9 ft. The transition zone appears to be much thicker than the freshwater lens. When the freshwater lens thickens, the brackish layer thins and the saline layer is displaced downward; when the lens thins, the brackish zone thickens, possibly suggesting brackish water diffusing upwards. The saline layer also appears to be very jagged and follows a sawtooth pattern, which is more prominent during the dry period. In some records, saltwater was not recorded, indicating that the BoTZ may be deeper than the well depth. EX-1 appears to have a stronger response to clusters of rain rather than large individual storms. It also appears to have a fast response to recharge as well as drought, with responses occurring within approximately 6 months. The lack of upgradient recharge from suprabasal waters may be contributing to its fast thinning during the dry season.
EX-4
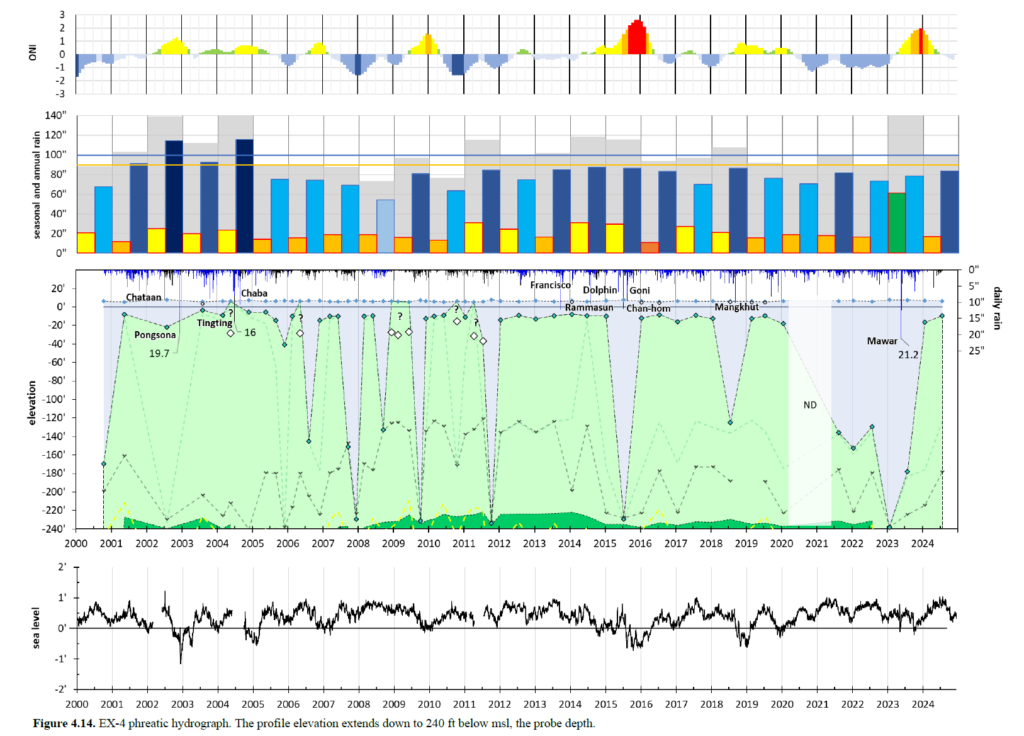
EX-4, located in the Pågu Basin east of the Hagåtña Basin, shows the flashiest and most complex freshwater lens of all the DOWs. Figure 4.14 shows freshwater lens thickness ranging from 9.3 ft in August 2003 to 246 ft in January 2023. Average freshwater lens thickness is 61.1 ft, with a mode of 15 ft. Based on the profiles, EX-4 appears to not have been drilled deep enough to reach the BoTZ and saltwater.
There were eight records (2004, 2006, 2008, 2009, 2010, and 2011) in which the probe recorded brackish water at the start of the profile, with starting elevations from 15 to 36 ft below msl. Therefore, it is not possible to determine whether the water above these elevations was fresh or brackish. There were also seven records from 2003, 2014, 2016, 2018, and 2019 in which the probe recorded brackish water above msl, shifted toward freshwater, and then shifted back to brackish. Because of these shallow brackish measurements, a VBA code was created and applied to skip depths shallower than 10 ft below msl (see Appendix E). These shallow brackish depths are plotted as white dots on the historic profile.
The response to annual rainfall from 100 to 120 in appeared to lead to thickening. EX-4 typically has a stronger response to rainfall clusters than to individual storms, with the exception following Typhoons Dolphin and Chan-hom (2015), when the freshwater lens reached approximately 237.1 ft by July 13, 2015, followed by rapid thinning. There were two instances in which annual rainfall exceeded 110 in, in 2011 and 2015, and the BoFL reached more than 229 ft below msl. These periods were followed by rapid thinning to the steady minimum thickness that persisted for more than two years, ranging from 8 to 16 ft below msl. However, when annual rainfall was about 140 in, it led to thinning of the freshwater lens. Following Typhoons Pongsona (2002) and Tingting/Chaba (2004), the BoFL was shallower than 10 ft below msl. After Typhoon Mawar (2023), the freshwater lens remained thick at 185.1 ft two months after the storm but thinned rapidly to 23.5 ft by January 2024.
During the drought period, EX-4 typically followed a seasonal pattern. The freshwater lens thickened to about 120–200 ft, and these increases were typically short term, occurred during the wet season, and were followed by rapid thinning by the next collection date. Following annual rainfall of less than 80 in, such as in 2008 and 2010, the lens was generally brackish. This may be due to upward diffusion of brackish water during periods of little to no recharge. Even during the drought period, when annual rainfall was at its minimum, the freshwater lens does not appear to thin any further but instead maintains a minimum thickness of approximately 9–16 ft.
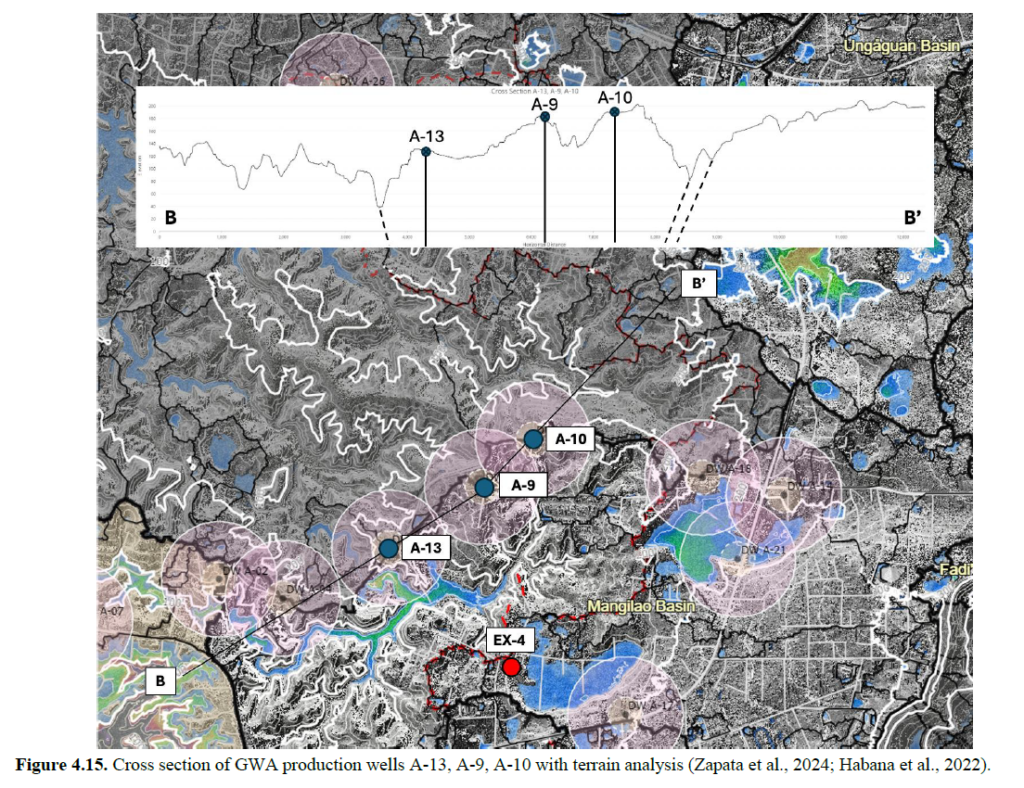
This may help explain high chloride concentrations in nearby GWA production wells A-13, A-9, and A-10, all of which exceed the 250 mg/L chloride threshold (Figure 4.15). Because the most frequent freshwater thickness is approximately 15 ft and GEPA well-depth regulations allow wells to extend 25–40 ft below msl, these production wells may penetrate the underlying brackish layer.
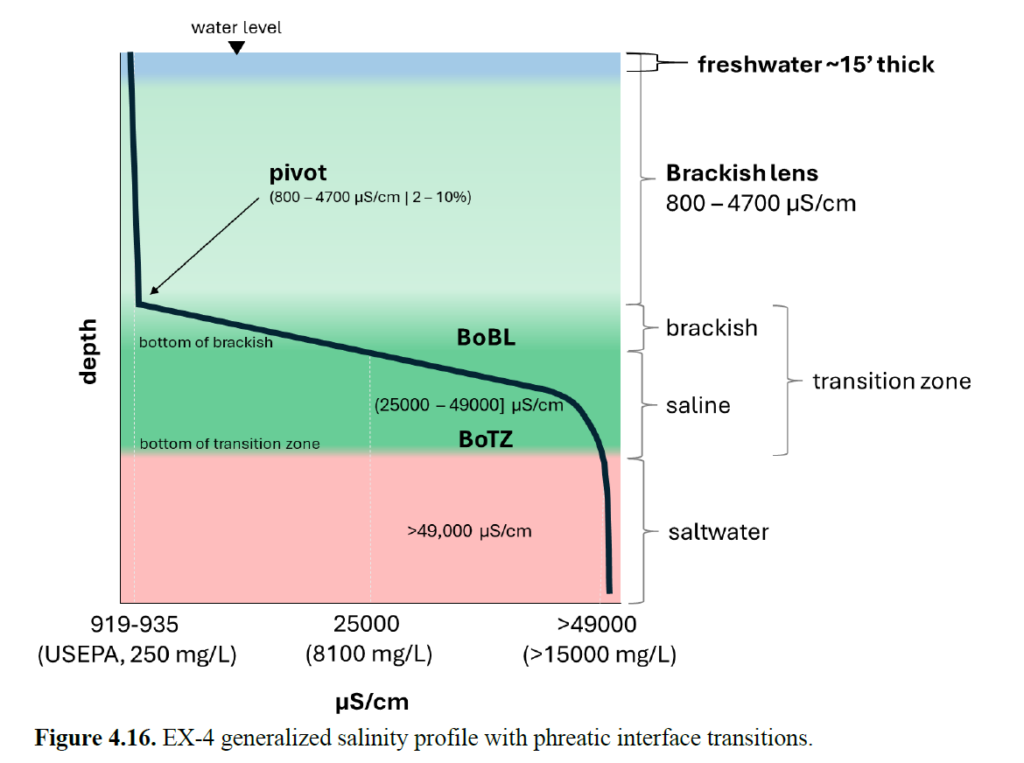
A brackish pivot analysis was also conducted for this DOW (see Appendix E), with the brackish pivot ranging from 800 to 4,700 μS/cm, about 2–10% of the salinity of seawater (Figure 4.16). In some records, the lens was brackish at the start of the probe record, and when freshwater thickness exceeded 200 ft, the lens usually extended to the brackish pivot depth. The average pivot depth was 182.21 ft below msl, ranging from 120 to 240 ft below msl. Shallower-than-average pivot depths generally occurred during the drought period.
Despite being about 1 mile from the nearest coast, no clear link was observed between sea-level drops and freshwater lens position. This may be due to the timing of CTD measurements and the stronger influence of rainfall.
Overall, EX-4 appears to have a thick brackish lens that is overlain by a thin freshwater lens that typically thickens following rainfall clusters, while its response to singular storms usually leads to thinning of the lens. When rapid thickening occurred, rapid thinning usually followed. However, when the lens maintained a steady thickness for more than one year, it usually did not thin as rapidly and instead maintained a steady thickness close to the minimum freshwater lens thickness. Its rapid thinning during the dry season may be due to the lack of upgradient recharge from suprabasal waters, unlike the Barrigada Limestone DOWs.
Overall Summary of DOWs
The nine DOWs had unique responses to recharge and drought. However, they can be further subcategorized by rock type, including the Barrigada Limestone DOWs (EX-8, EX-10, GHURA-Dededo, EX-7, EX-7A, EX-6, and EX-9) and the Hagåtña Argillaceous DOWs (EX-1 and EX 4).
The two DOW groups mainly differed in their response to recharge and drought. The Barrigada Limestone DOWs generally thickened following annual rainfall greater than 100 in, with a stronger thickening response after annual rainfall exceeded 140 in, especially during years when typhoons brought substantial rainfall to Guam. Their recharge response usually occurred within 6 months to 1 year, while thinning to minimum freshwater lens thicknesses generally took longer, often more than 1 year during dry periods. The transition zones for these DOWs were generally stable and maintained relatively steady thicknesses over time.
DOWs located within the Hagåtña Argillaceous limestone, however, were much flashier and more variable in response to recharge and drought. These DOWs typically had thick brackish lenses with a thin freshwater lens overlying them. Freshwater lens thickening was generally rapid after annual rainfall greater than 100 in, but the lens also tended to thin rapidly. Annual rainfall greater than 140 in did not consistently lead to thickening and was often followed by thinning. Additionally, these DOWs generally showed stronger thickening responses to clusters of wet-season rainfall than to individual storm events, such as typhoons. The transition zones of these DOWs were generally much thicker and more variable.
DOW and Aquifer Basin Cross Sections
Cross sections were created to provide geologic context for the observed differences in freshwater lens response among the DOWs. Figure 4.17 shows the locations of the six selected cross section lines used in this analysis. For clarity and page fit, the cross sections are presented as figure subsections with 10× vertical exaggeration. They are grouped into Machanao, Tomhom, Hagåtña, and Pågu sets. Surface geology is based on the Geologic Map of Guam (Siegrist et al., 2007), while subsurface interpretations are based on General Geology of Guam (Tracey et al., 1964), available drill logs and descriptions, and geophysical logs (caliper, gamma, and electrical) from the GHS Borehole Database (Bendixson et al., 2013). Surface terrain is based on the 2020 DEM. Subsurface geology between DOWs, particularly formation contacts, is inferred and shown with dashed lines. Hydraulic head (h), mean sea level, modeled freshwater lens elevation (z), minimum and maximum BoFL depths from the same profile dates, and DOW and borehole depths are also shown.
Machanao
EX-8
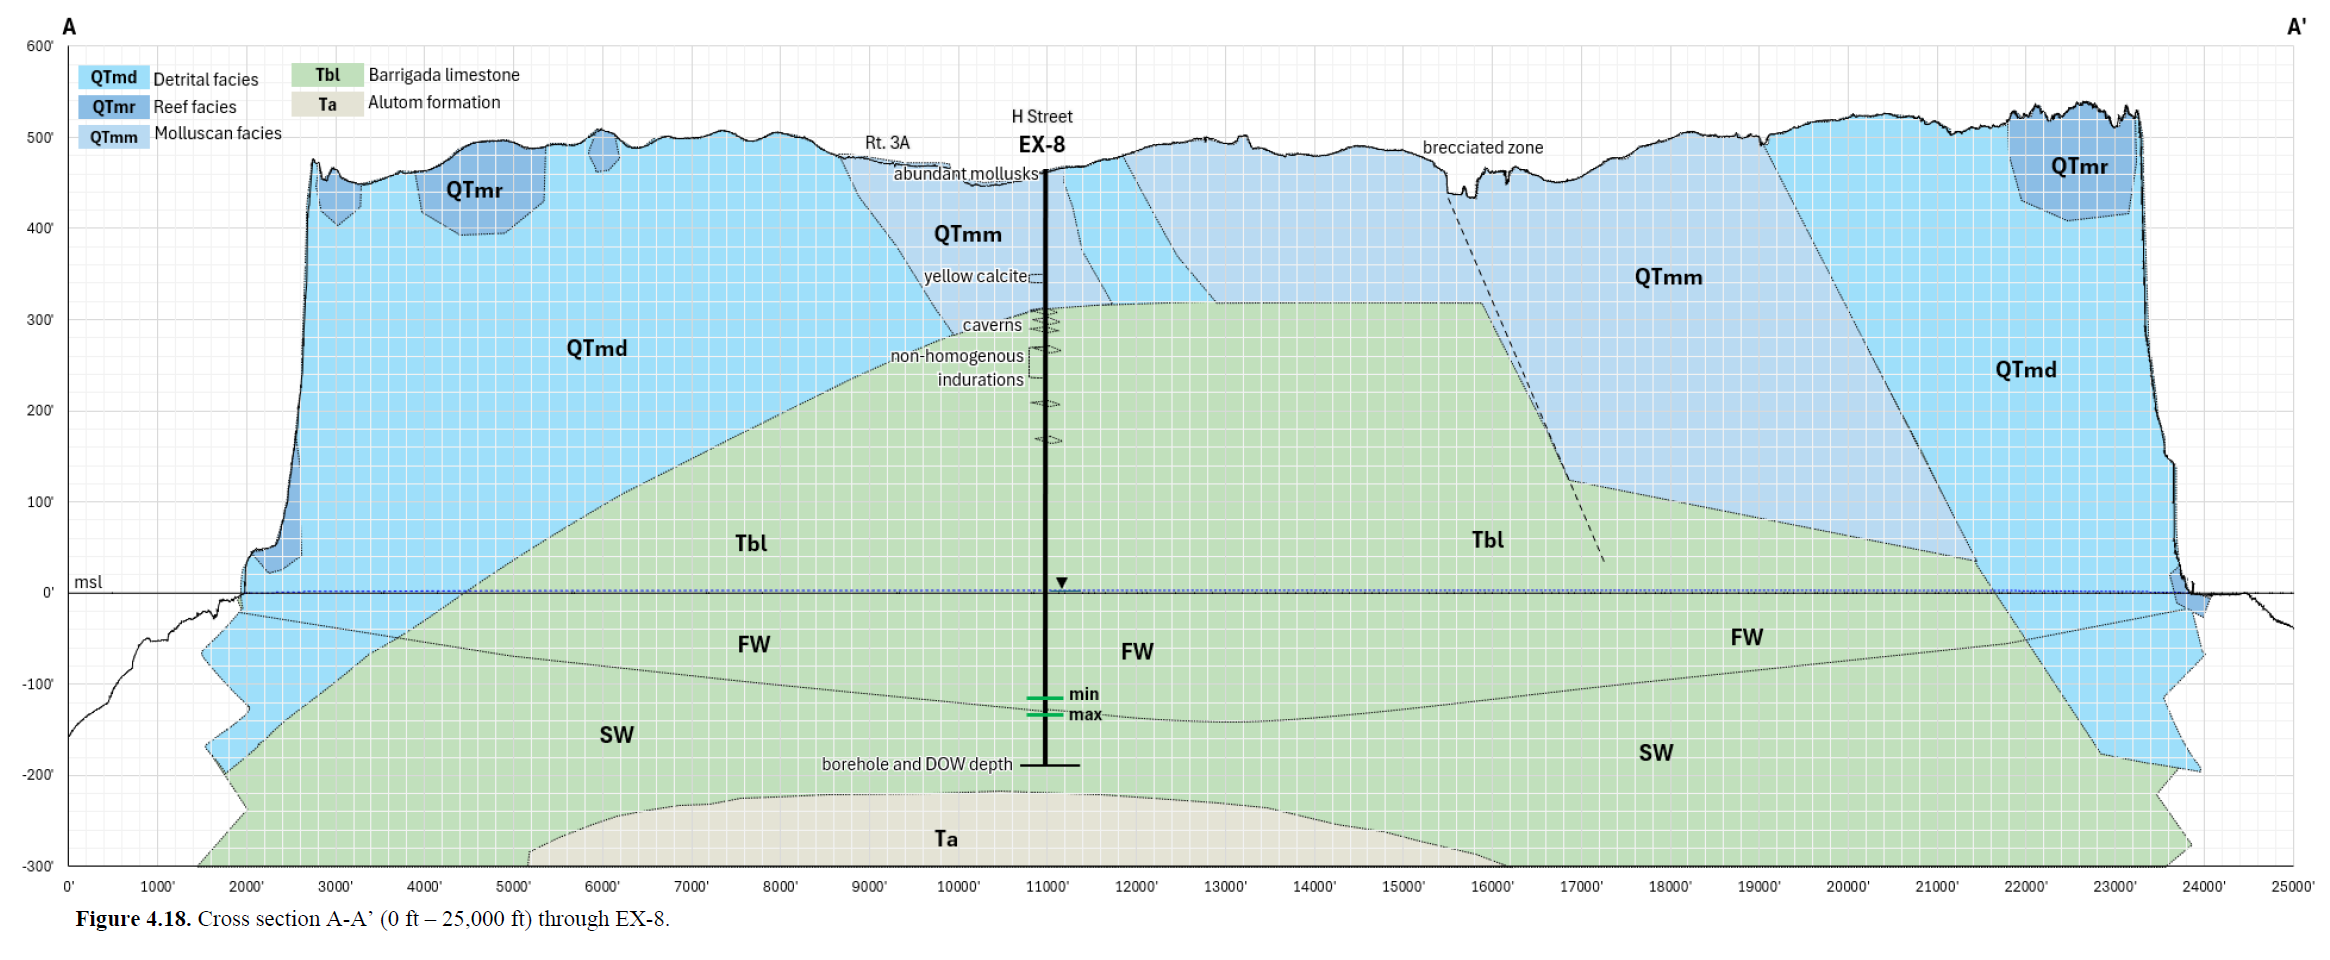
Cross section A–A′ examines the geology of EX-8 within the Machanao Basin and provides context for its freshwater lens response. Figure 4.18 shows cross section A‑A′ passing through EX-8 and the reef, detrital, and molluscan facies of the Mariana Limestone (QTmr, QTmd, and QTmm, respectively). The section also intersects Route 3A, H Street, and a collapsed brecciated zone at approximately 15,000 ft from the origin. At EX-8, land surface is ~460 ft above msl, indicating a thick vadose zone. The borehole extends to 658 ft below land surface, and minimum and maximum BoFL depths range from ~111 to 132 ft below msl. Although the drill log does not indicate that the borehole reached volcanic basement, basement topography was interpreted from the NGLA Map (2018).
The borehole log indicates that EX-8 penetrates QTmm and Barrigada Limestone (Tbl). Molluscan shell material observed near the surface is consistent with QTmm (Ikehara, 1981). Cavities recorded at depths of ~150 to 300 ft below land surface may indicate increased secondary porosity near the contact where QTmm unconformably overlies Tbl, which could promote vertical recharge. The drill log also notes nonhomogeneous induration, further suggesting lithologic heterogeneity. Overall, the cross-section suggests that secondary porosity may promote recharge at EX-8, although the thick vadose zone likely delays its transmission to the freshwater lens.
Tomhom
EX-10 - GHURA-Dededo
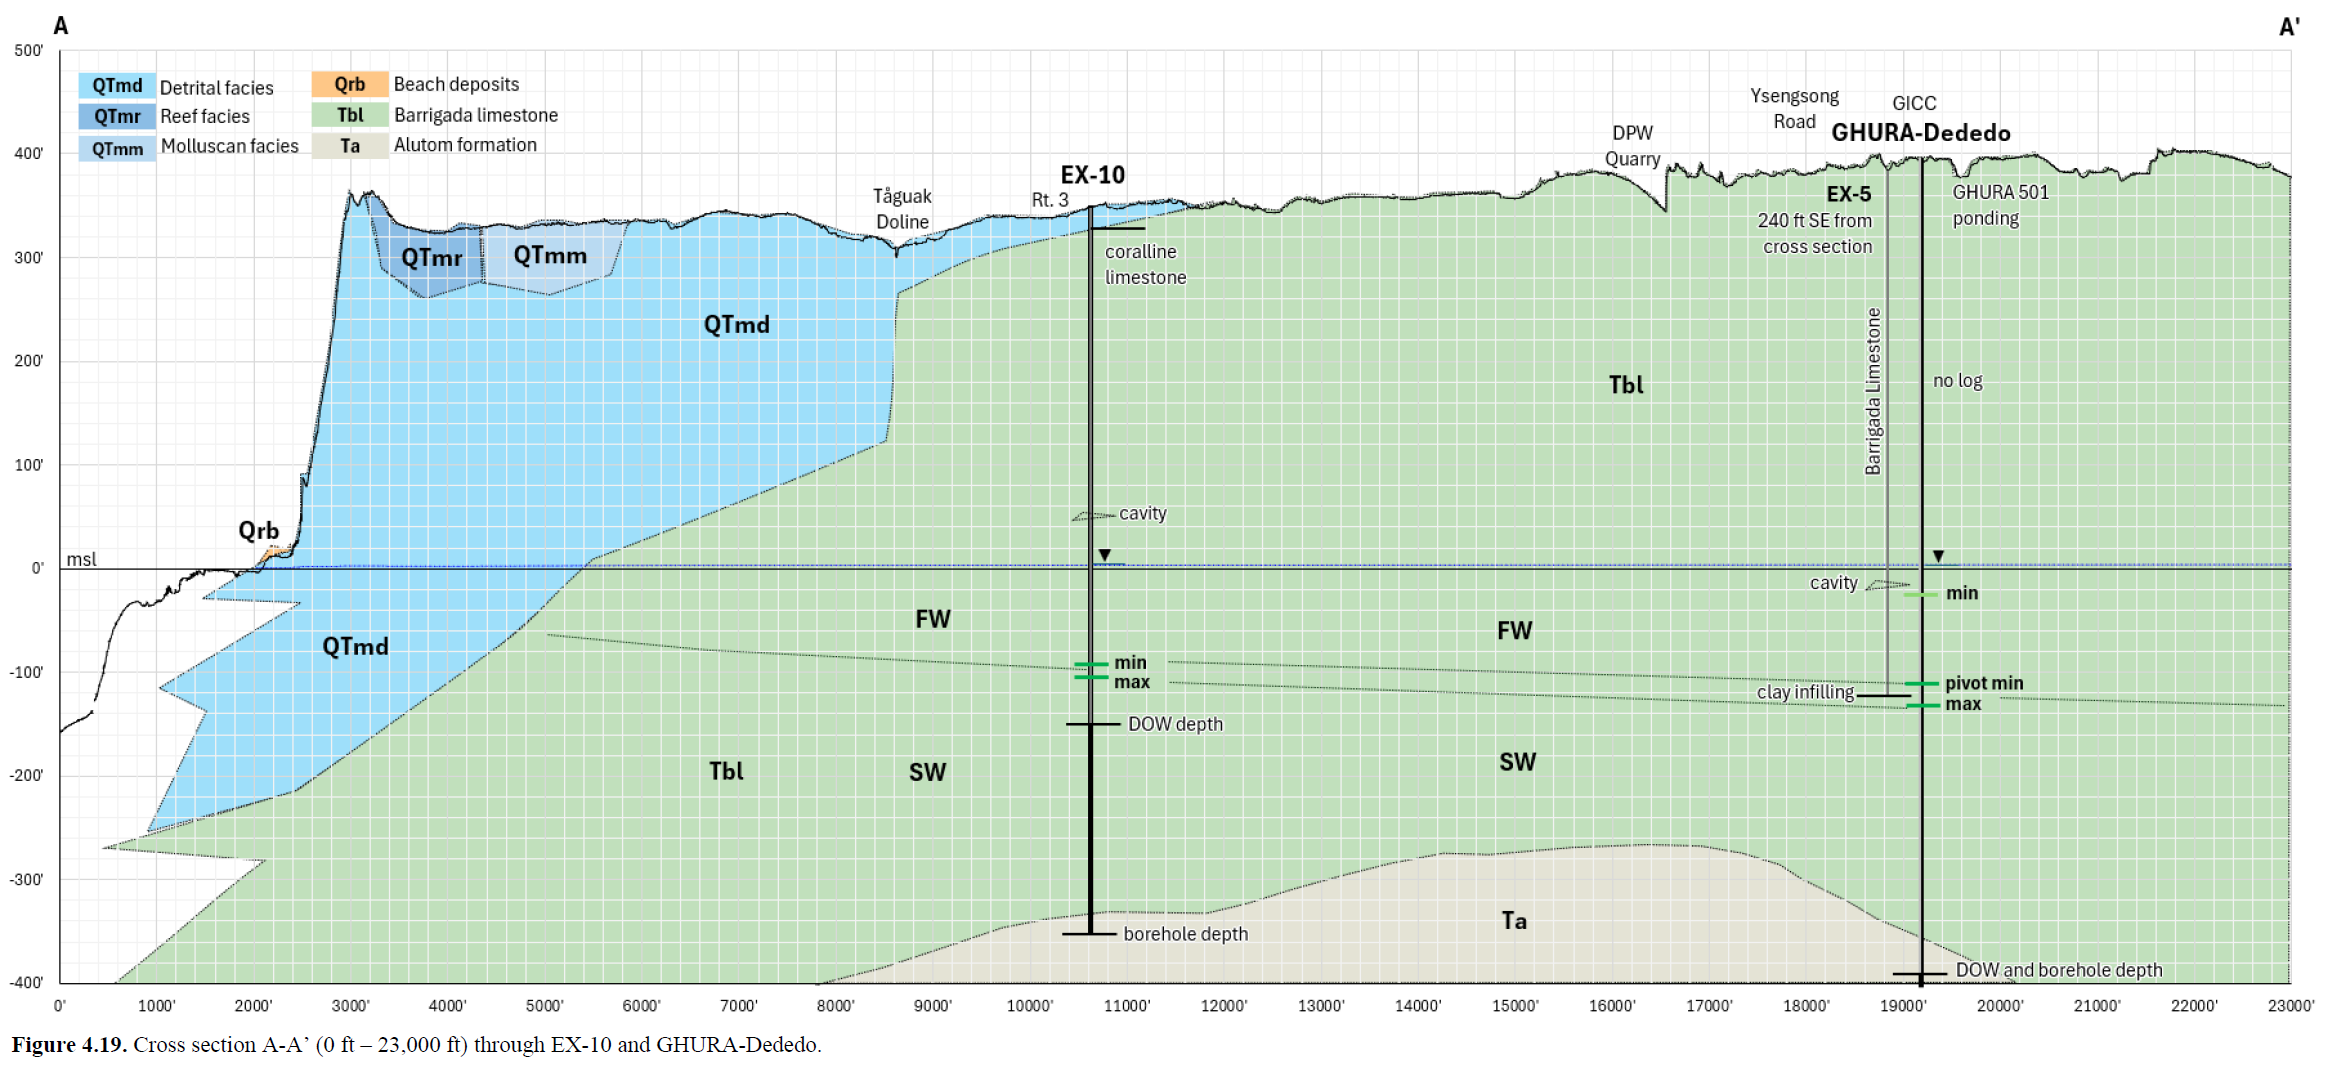
Cross section A–A′ examines the geology of EX-10 and GHURA-Dededo within the Tomhom Basin and provides context for differences in freshwater lens thickness between the two DOWs. Figure 4.19 shows cross section A–A′ passing through EX-10 and GHURA-Dededo. Formations include beach deposits (Qrb), QTmd, QTmr, QTmm, and Tbl. Surface features include Tåguak Doline, the DPW Quarry, the GHURA 501 ponding basin, Route 3, and Ysengsong Road. EX-5 is located approximately 240 ft southeast of the cross section.
At EX-10, land surface is approximately 348 ft above msl, DOW depth is 491 ft, borehole depth is 704 ft, and the probe extends to about 144 ft below msl. Minimum and maximum BoFL depths range from about 99 to 106 ft below msl. At GHURA-Dededo, land surface is approximately 395 ft above msl, DOW depth is 785 ft, and the probe extends to about 385 ft below msl. Minimum and maximum BoFL depths range from about 33 to 135 ft below msl, and the minimum pivot depth is about 113 ft below msl.
Subsurface interpretation along the cross section includes the Alutom Formation (Ta). At EX-10, the drill log records coralline limestone at about 20–30 ft below ground surface, suggesting that QTmd pinches into Barrigada Limestone at this location. A 5-ft cavity was also noted at about 312-317 ft below land surface (GEPA, 1981). No drill log was available for GHURA-Dededo, but the nearby EX-5 production well provides supporting lithologic information. Its drill log describes packstone, wackestone, and mudstone with abundant foraminiferal tests, poorly preserved coral and molluscan material, a cavity at about 420–430 ft below land surface, and clay infilling near 531 ft (Ikehara, 1982). These variations in texture and cementation suggest subsurface heterogeneity.
GHURA-Dededo has a thicker maximum freshwater lens than EX-10, consistent with inland thickening of the freshwater lens and thinning toward the coast. GHURA-Dededo’s more inland location and more favorable position to receive upgradient recharge may allow a thicker freshwater lens to develop, while EX-10’s closer proximity to the coast may contribute to its thinner and less responsive lens. Overall, the cross section provides geologic context for the observed difference in freshwater lens thickness between the two DOWs.
EX-7A - GHURA-Dededo
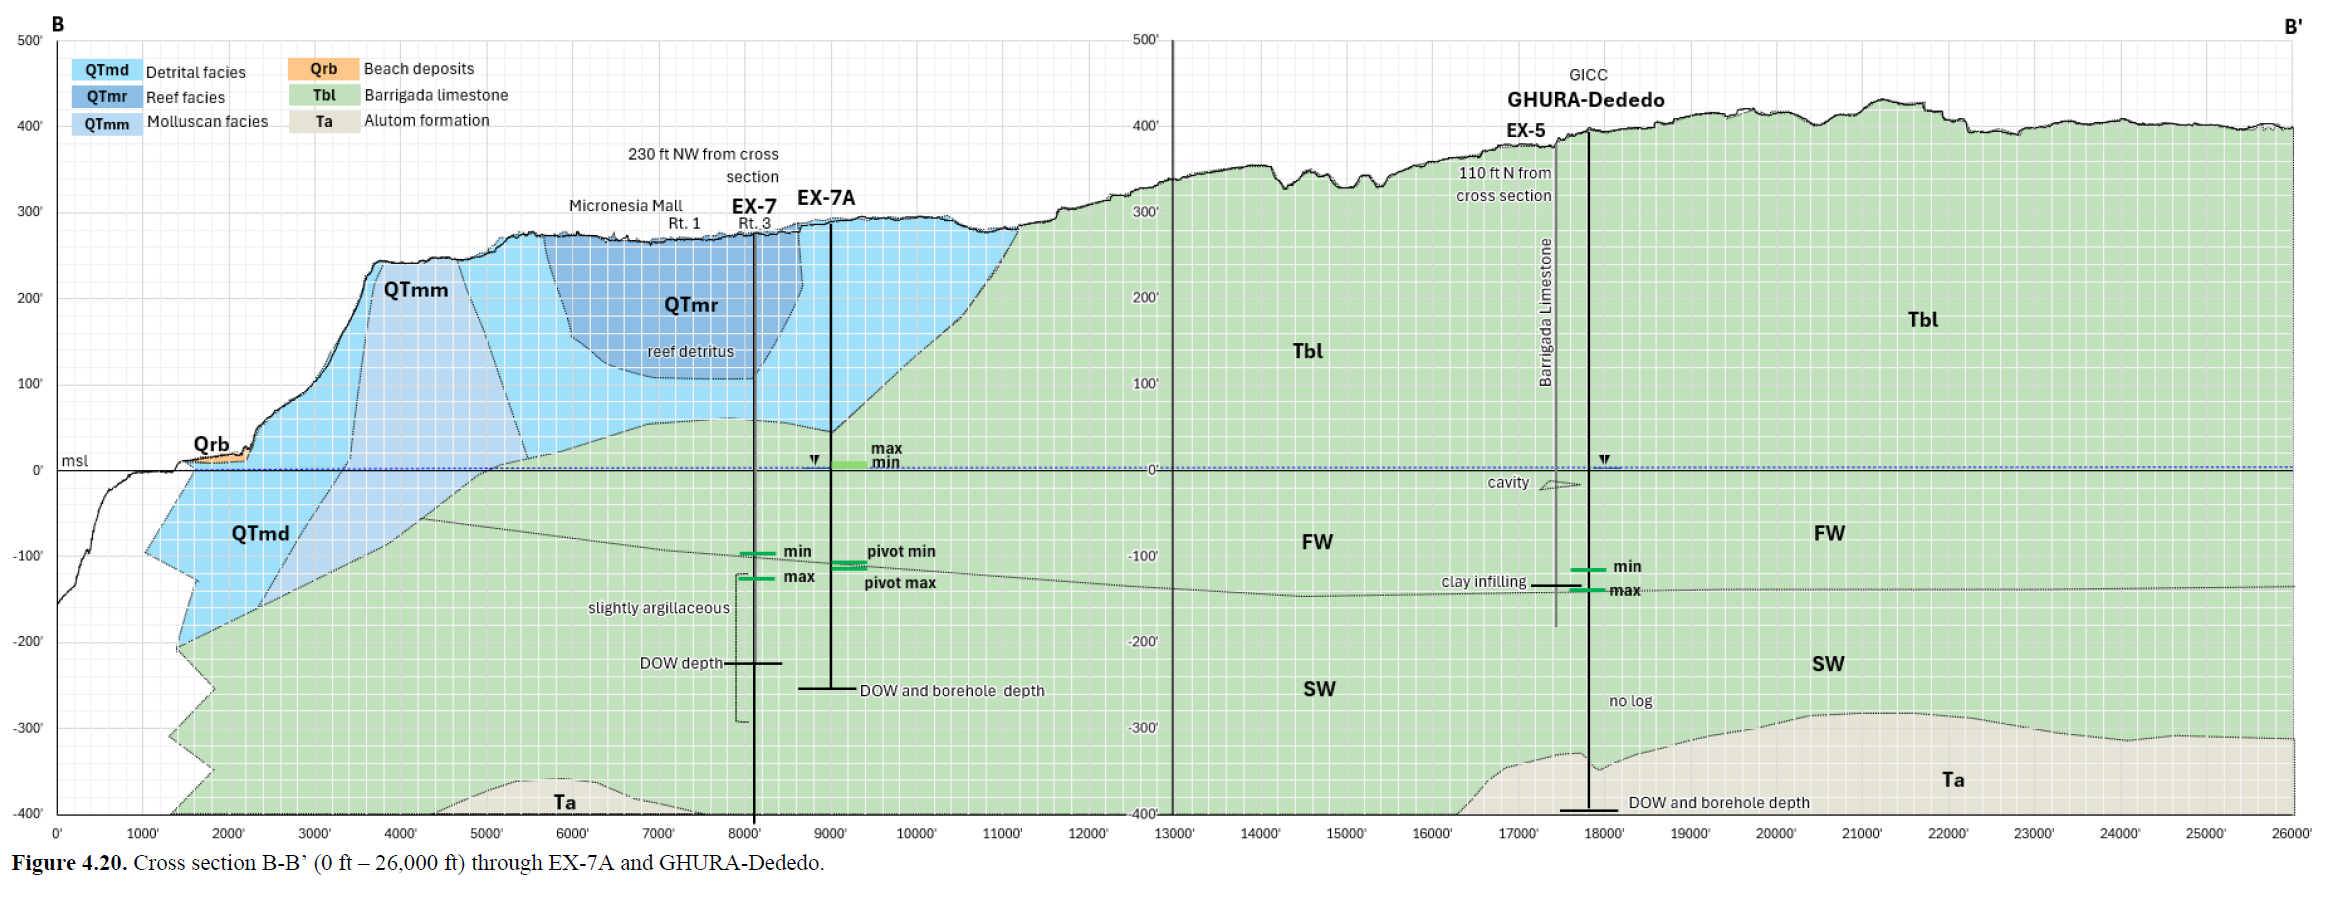
Cross section B–B′ examines the geology between EX-7A and GHURA-Dededo within the Tomhom Basin and provides context for the sharp contrast in freshwater lens thickness between the two DOWs. Figure 4.20 shows cross section B–B′ passing through EX‑7A and GHURA-Dededo and the Qrb, QTmm, QTmd, QTmr, Tbl, and Ta formations. Surface features include Route 1, Route 3, and the GICC Golf Course. EX-7 is located approximately 230 ft northwest of the cross section, and EX-5 is about 110 ft north of it.
Based on the drill log, EX-7A penetrates QTmd, then transitions into Tbl, as indicated by slightly friable limestone, although this contact remains uncertain (Bautista, 2019). The EX-7A drill log describes the detrital facies of the Mariana Limestone as friable to well-cemented, generally porous, and cavernous limestone of lagoonal origin. This variability in cementation and porosity may influence local permeability and recharge transmission near the DOW. More well-cemented intervals could reduce freshwater movement into the borehole during periods of little to no recharge, which may allow upward diffusion or persistence of brackish water and help explain why EX-7A was brackish upon probe entry in the historic profiles. No drill log is available for GHURA-Dededo; however, the nearby EX-5 production well provides supporting lithologic information described in the previous section.
At EX-7A, land surface is approximately 290 ft above msl, DOW depth is 246 ft, and the probe extends to about 243 ft below msl. Minimum and maximum BoFL elevations range from about 2 to 4 ft above msl, while pivot depth ranges from about 103 to 105 ft below msl. At GHURA-Dededo, land surface is approximately 395 ft above msl, DOW depth is 785 ft, and the probe extends to about 385 ft below msl. Minimum and maximum BoFL depths range from about 123 to 135 ft below msl.
This contrast indicates that, unlike the thicker freshwater lens at GHURA-Dededo, EX-7A shows brackish water immediately at the start of the profile based on the 250 mg/L chloride threshold. The lithologic variability described in the EX-7A drill log may partly explain this brackish lens, especially during periods of reduced recharge.
EX-7A - EX-10
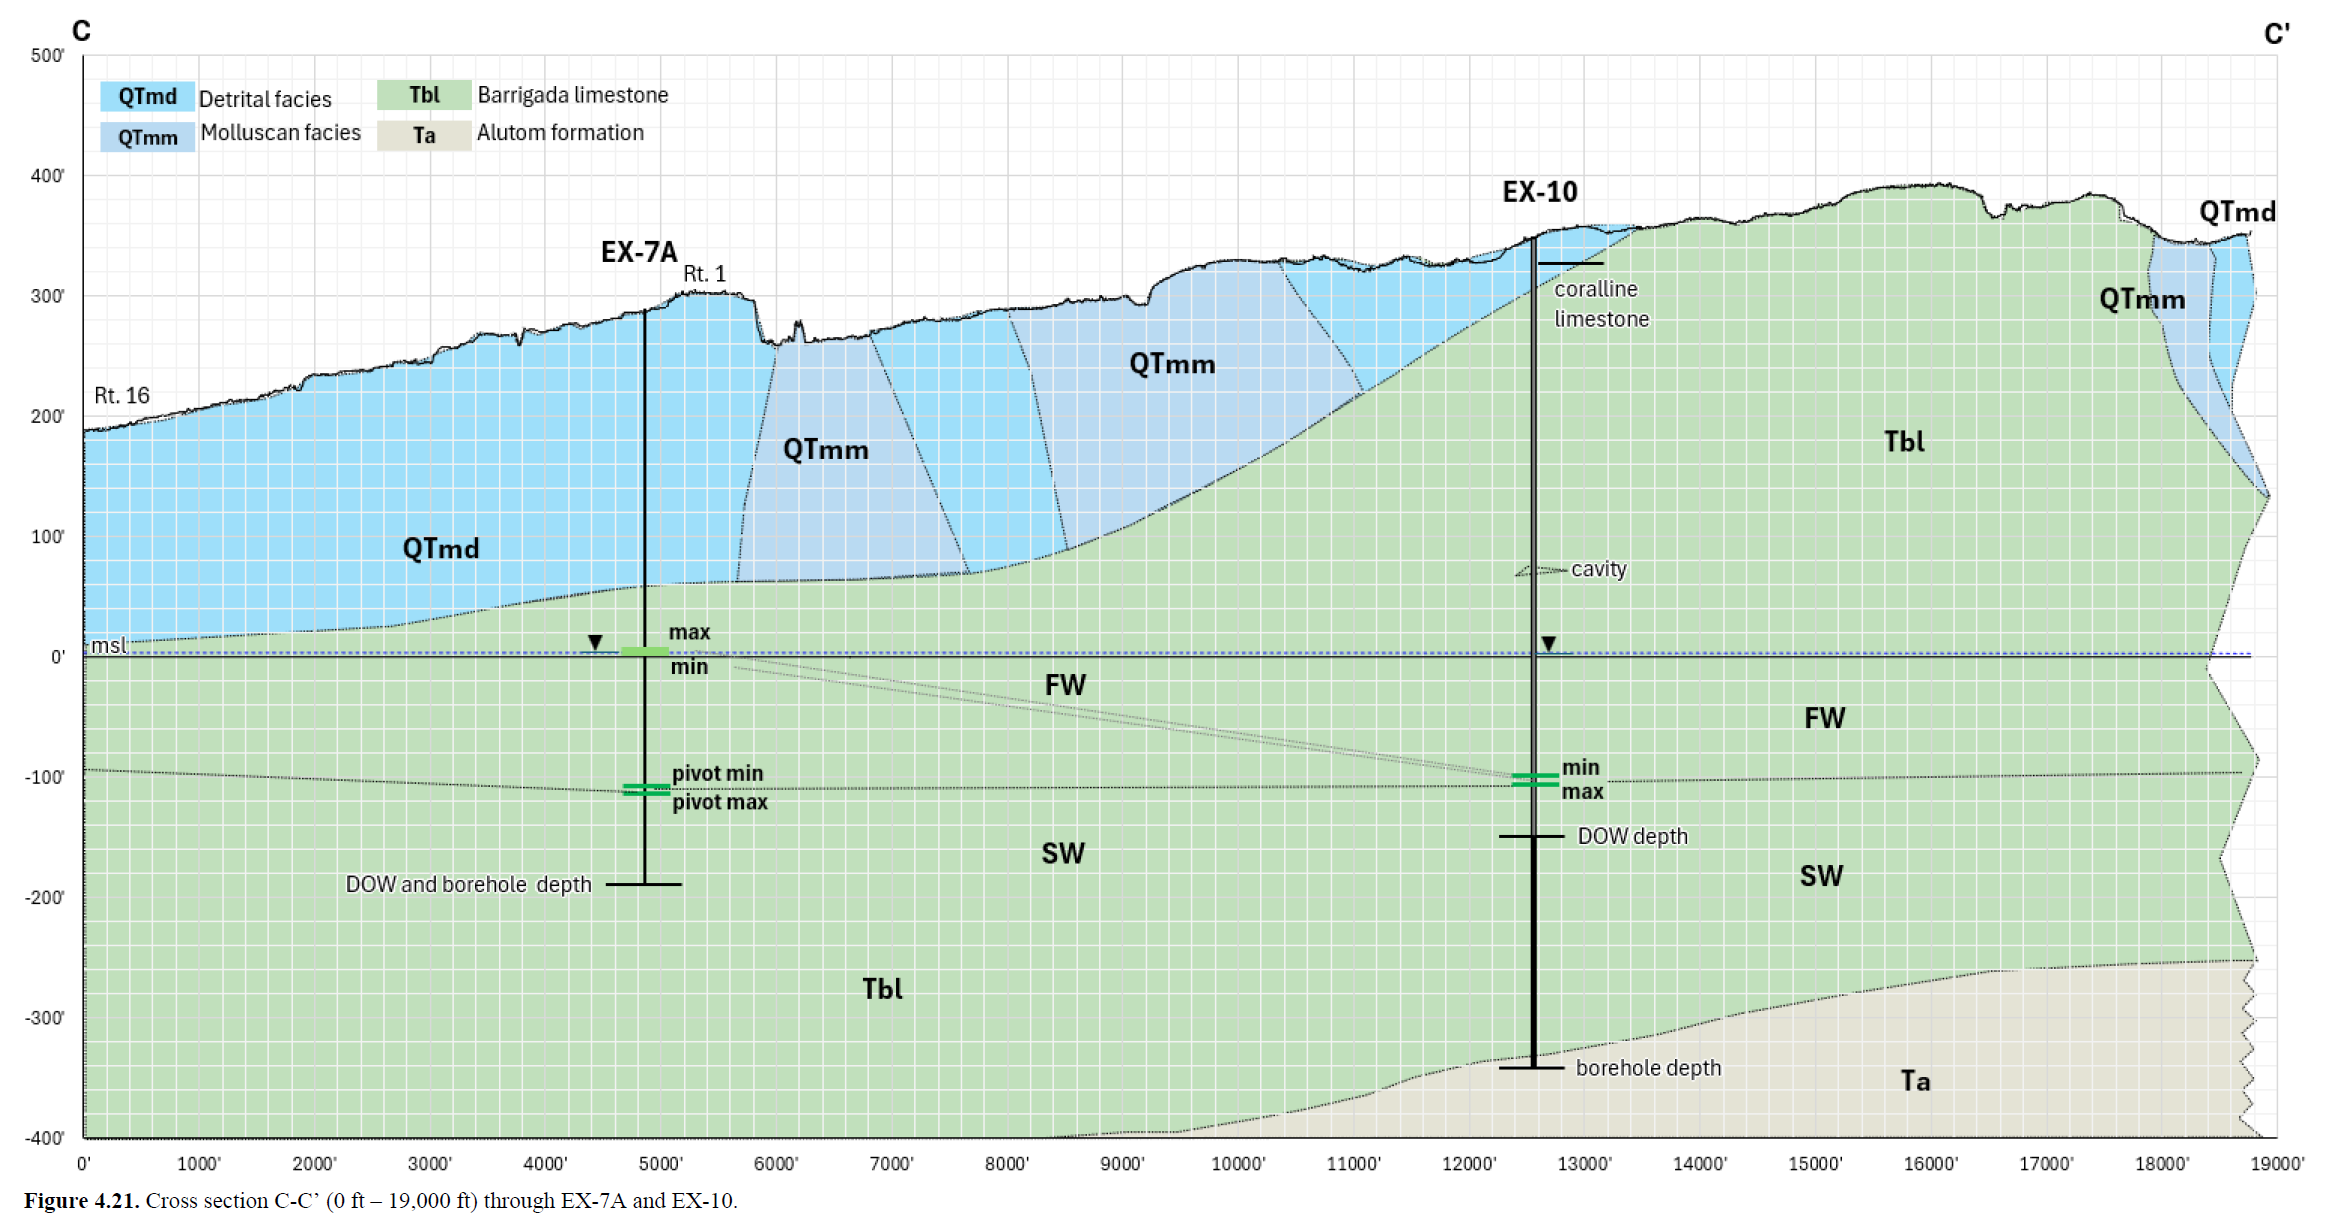
Cross section C–C′ examines the geology between EX-7A and EX-10 within the Tomhom Basin and provides context for differences in freshwater lens response between the two DOWs. Figure 4.21 shows cross section C–C′ passing through EX-7A and EX-10. Formations include QTmd, QTmm, Tbl, and Ta. Surface features include Route 16 and Route 1. At EX-7A, minimum and maximum BoFL elevations are above msl, while the brackish pivot ranges from about 103 to 105 ft below msl. At EX-10, minimum and maximum BoFL depths range from about 97 to 106 ft below msl.
At EX-7A, land surface is approximately 290 ft above msl, DOW depth is 246 ft, and the probe extends to about 243 ft below msl. The drill log indicates that EX-7A is drilled through QTmd and may transition into Tbl at about 240 ft below ground surface, although the subsurface contact is inferred (Bautista, 2019).
At EX-10, land surface is approximately 348 ft above msl, DOW depth is 491 ft, and the probe extends to about 144 ft below msl. Based on the Geologic Map of Guam (Siegrist et al., 2007), EX-10 is drilled through QTmd, which may transition into Tbl and is underlain by volcanic basement. The drill log records coralline limestone at about 20–30 ft below ground surface and a possible cavity at about 312–317 ft below ground surface (GEPA, 1981). EX-10 is the least responsive DOW, with only slight responses to both recharge and drought. Local geology may be one factor dampening its response.
The differences between EX-7A and EX-10 highlight local hydrogeologic variability within the Tomhom Basin. Although both DOWs are interpreted to penetrate QTmd and transition into Tbl, EX-7A shows a brackish lens, whereas EX-10 has a thicker and more stable freshwater lens. This contrast may reflect differences in local lithology, including the variable cementation and porosity described in the EX-7A drill log, as well as secondary porosity and recharge transmission near each DOW.
Hagåtña and Pågu
EX-1 - EX-4
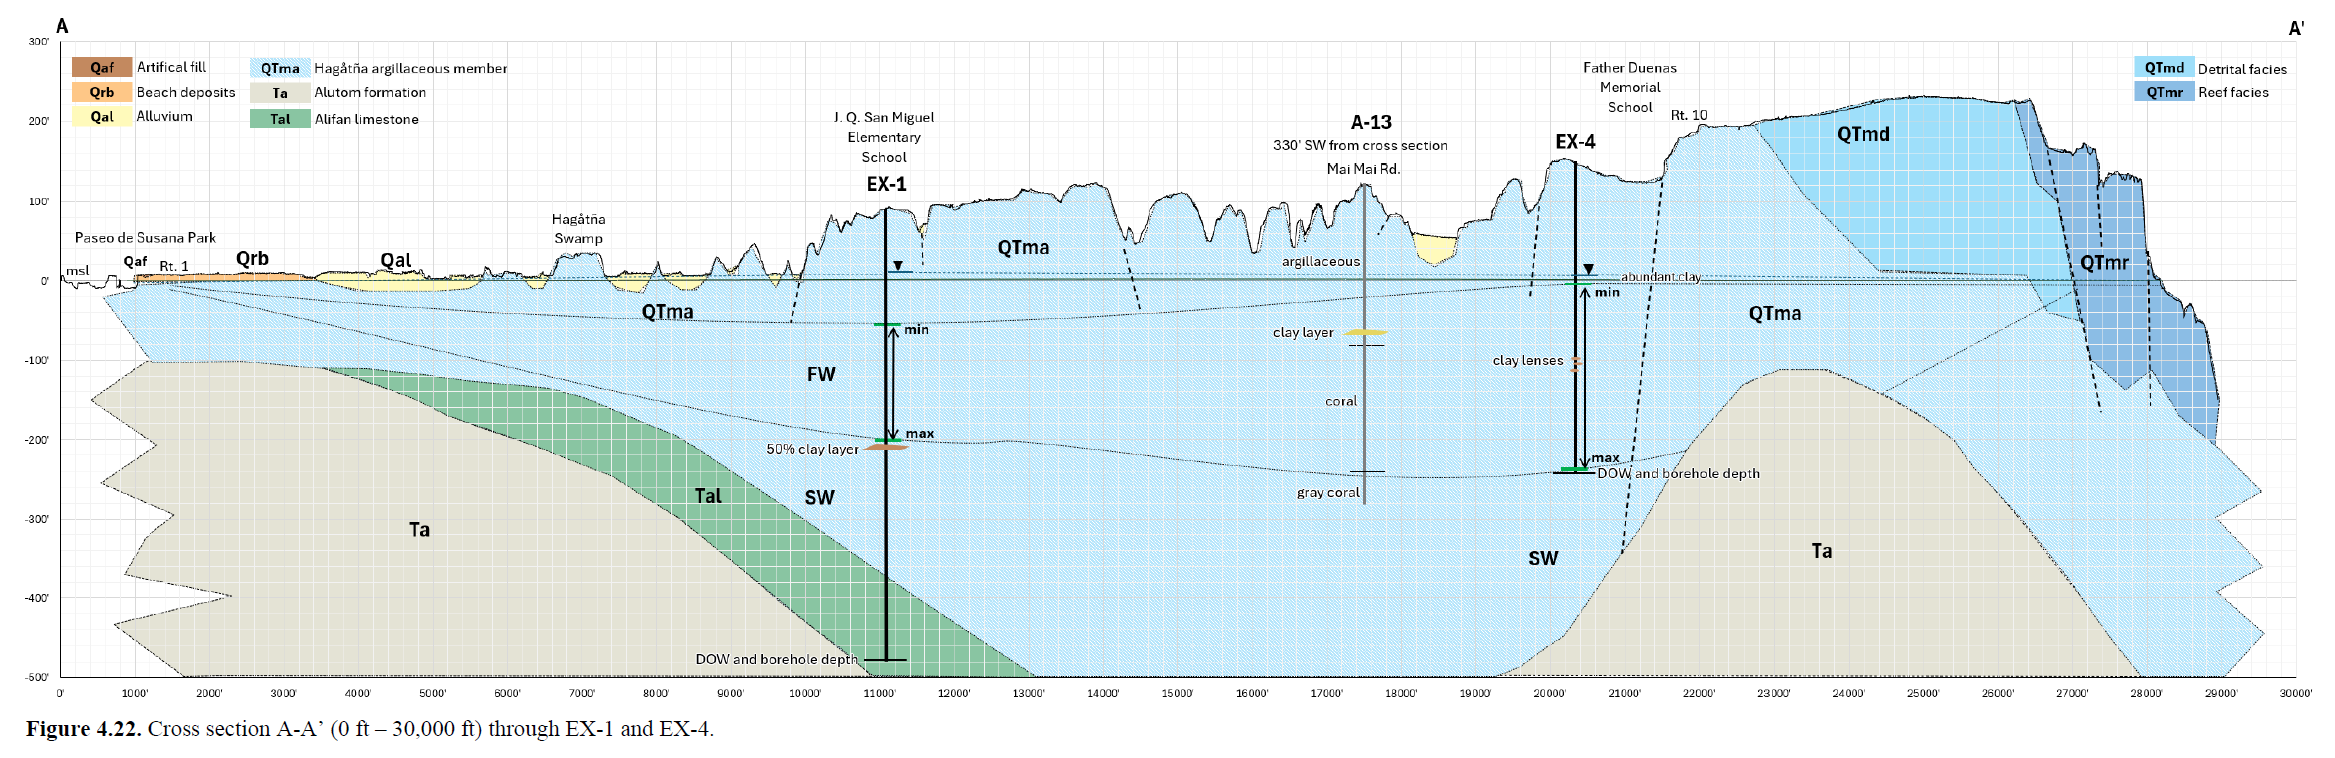
Cross section A–A′ examines the geology of EX-1 and EX-4 across the Hagåtña and Pågu Aquifer Basins and provides context for their complex freshwater lens responses. Figure 4.22 shows cross section A–A′ passing through EX-1 near J.Q. San Miguel Elementary School and EX-4 near Father Dueñas Memorial School. The cross section includes artificial fill (Qaf), beach deposits (Qrb), alluvium (Qal), Alutom Formation (Ta), the Hagåtña Argillaceous Member of the Mariana Limestone (QTma), detrital and reef facies of the Mariana Limestone (QTmd and QTmr), and Alifan Limestone (Tal). Surface features include Paseo de Susana Park, Route 1, Hagåtña Swamp, and Route 10. GWA production well A-13 is located approximately 330 ft southwest of the cross section.
At EX-1, land surface is approximately 94 ft above msl, DOW depth is 572 ft, and the probe extends to about 478 ft below msl. Minimum and maximum BoFL depths range from about 53 to 202 ft below msl. At EX-4, land surface is approximately 154 ft above msl, DOW depth is 390 ft, and the probe extends to about 240 ft below msl. Minimum and maximum BoFL depths range from about 10 to 239 ft below msl.
Surface terrain around EX-1 is fluvial and appears to be eroded. To the left of EX-1, the cross section intersects the Hagåtña Swamp, which contains alluvial deposits within swampy terrain. Terrain to the left of EX-4, near A-13, also appears fluvial and eroded and may be faulted. In contrast, terrain to the right of EX-4 is flatter and more plateau-like. A possible fault is marked by the scarp-like feature near Route 10.
EX-1 may reflect localized freshwater–brackish water mixing, lateral subsurface flow through fractured limestone, and reduced recharge due to lower hydraulic conductivity relative to the Barrigada Limestone (Simard et al., 2015). The DOW is located within merokarstic, argillaceous limestone near the Hagåtña Swamp. EX-1’s proximity to the coast, about 1.3 mi, and its location near the Hagåtña Swamp may help explain its rapid thinning, as groundwater may discharge toward the swamp and Hagåtña River. It is also notable that Hagåtña Spring, which discharges through the Hagåtña Swamp, has a higher chloride concentration (80-190 mg/L) compared to a site in the Hagåtña River that is much closer to the ocean (Kim et al., 2025).
A clay-rich layer, estimated at approximately 50% clay, was identified in the borehole log at about 293 to 300 ft below land surface, or about 200 to 210 ft below msl, and may partially inhibit upward saltwater migration (Ikehara, 1981a; Ikehara, 1981b). The average bottom of the brackish layer (BoBL) occurs at approximately 240 ft below msl. This clay layer may help explain the persistence of a thick saline layer below it, whereas the thick brackish layer above may be due to lateral saltwater intrusion along cavities or fractures.
The available geophysical logs for EX-1 were also examined. The caliper log widens to about 20 in at 30 to 40 ft below msl, which may indicate voids, fractures, or collapse of wall material within the borehole (Ikehara, 1981a). EX-1 is interpreted to penetrate the QTma and Tal formations. Schlanger et al. (1964) noted that lateral groundwater movement likely occurs along the contact between the volcanic basement and Tal, which may contribute to the brackishing of the lens observed at EX-1.
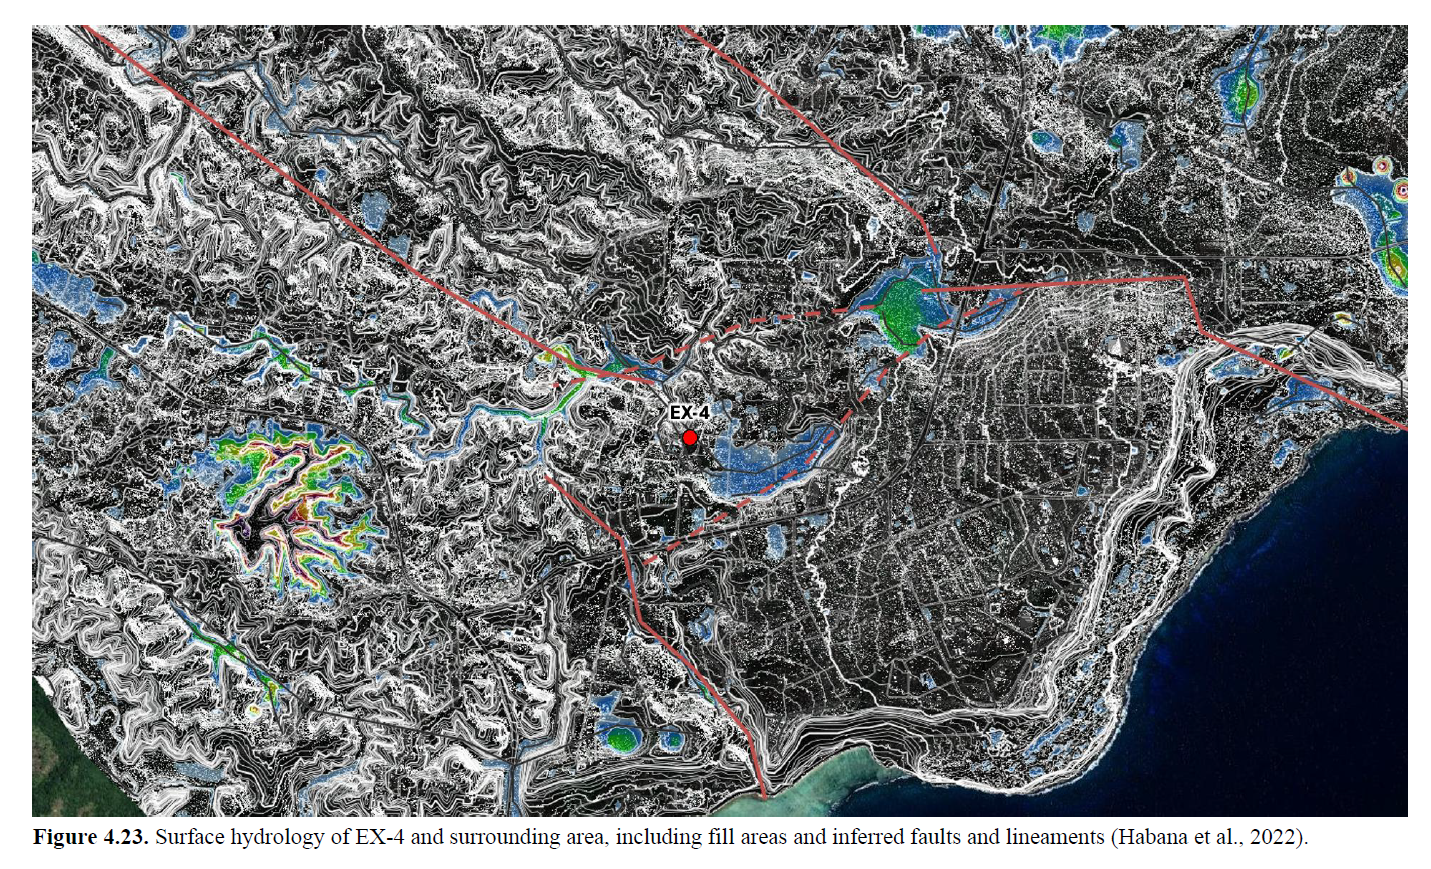
EX-4 is located within the merokarstic Hagåtña Argillaceous Member of the Mariana Limestone, near mapped and inferred faults, and within a basal graben structure (Figure 4.23). These features may promote rapid lateral groundwater movement, including both focused freshwater recharge and lateral saltwater encroachment. The merokarstic terrain likely affects recharge by reducing matrix porosity and hydraulic conductivity, which may contribute to rapid thinning following freshwater lens thickening. EX-4 is also the closest DOW to the coast, approximately 1 mi inland, which may further contribute to its rapid thinning. Its proximity to faulted peripheral Mariana Limestone may allow freshwater to discharge more readily, reducing the ability of the lens to remain thick for long periods.
A gamma-log peak indicates clay-rich material within the limestone, and clay lenses were identified at around 100 ft below msl (Ikehara, 1981a; Ikehara, 1981b). The drill description also indicates predominantly argillaceous limestone. These observations suggest that clay-rich intervals, possible faulting, and fluvial terrain may contribute to brackish mixing and a flashy lens at EX-4. The lack of sustained upgradient recharge, along with clay-rich limestone and lower hydraulic conductivity, may contribute to the rapid thinning observed at EX-4. Compared to the Barrigada Limestone, this area appears less favorable for groundwater storage because of its lower effective porosity, lower permeability, and more complex structural setting.
Although EX-1 and EX-4 are located in different aquifer basins, both occur within merokarstic limestone where clay-rich rock, possible faulting, fractures, and cavities may influence groundwater mixing and lens structure. Local geology may also help explain why the freshwater lens does not appear to thin beyond a certain minimum thickness at both DOWs. The relatively shallow depth to water at EX-1 and EX-4, approximately 89.5 ft and 147.5 ft below land surface, respectively, may allow recharge to reach the freshwater lens more quickly, contributing to their faster response compared to deeper DOWs in the Barrigada Limestone.
EX-1 - EX-9
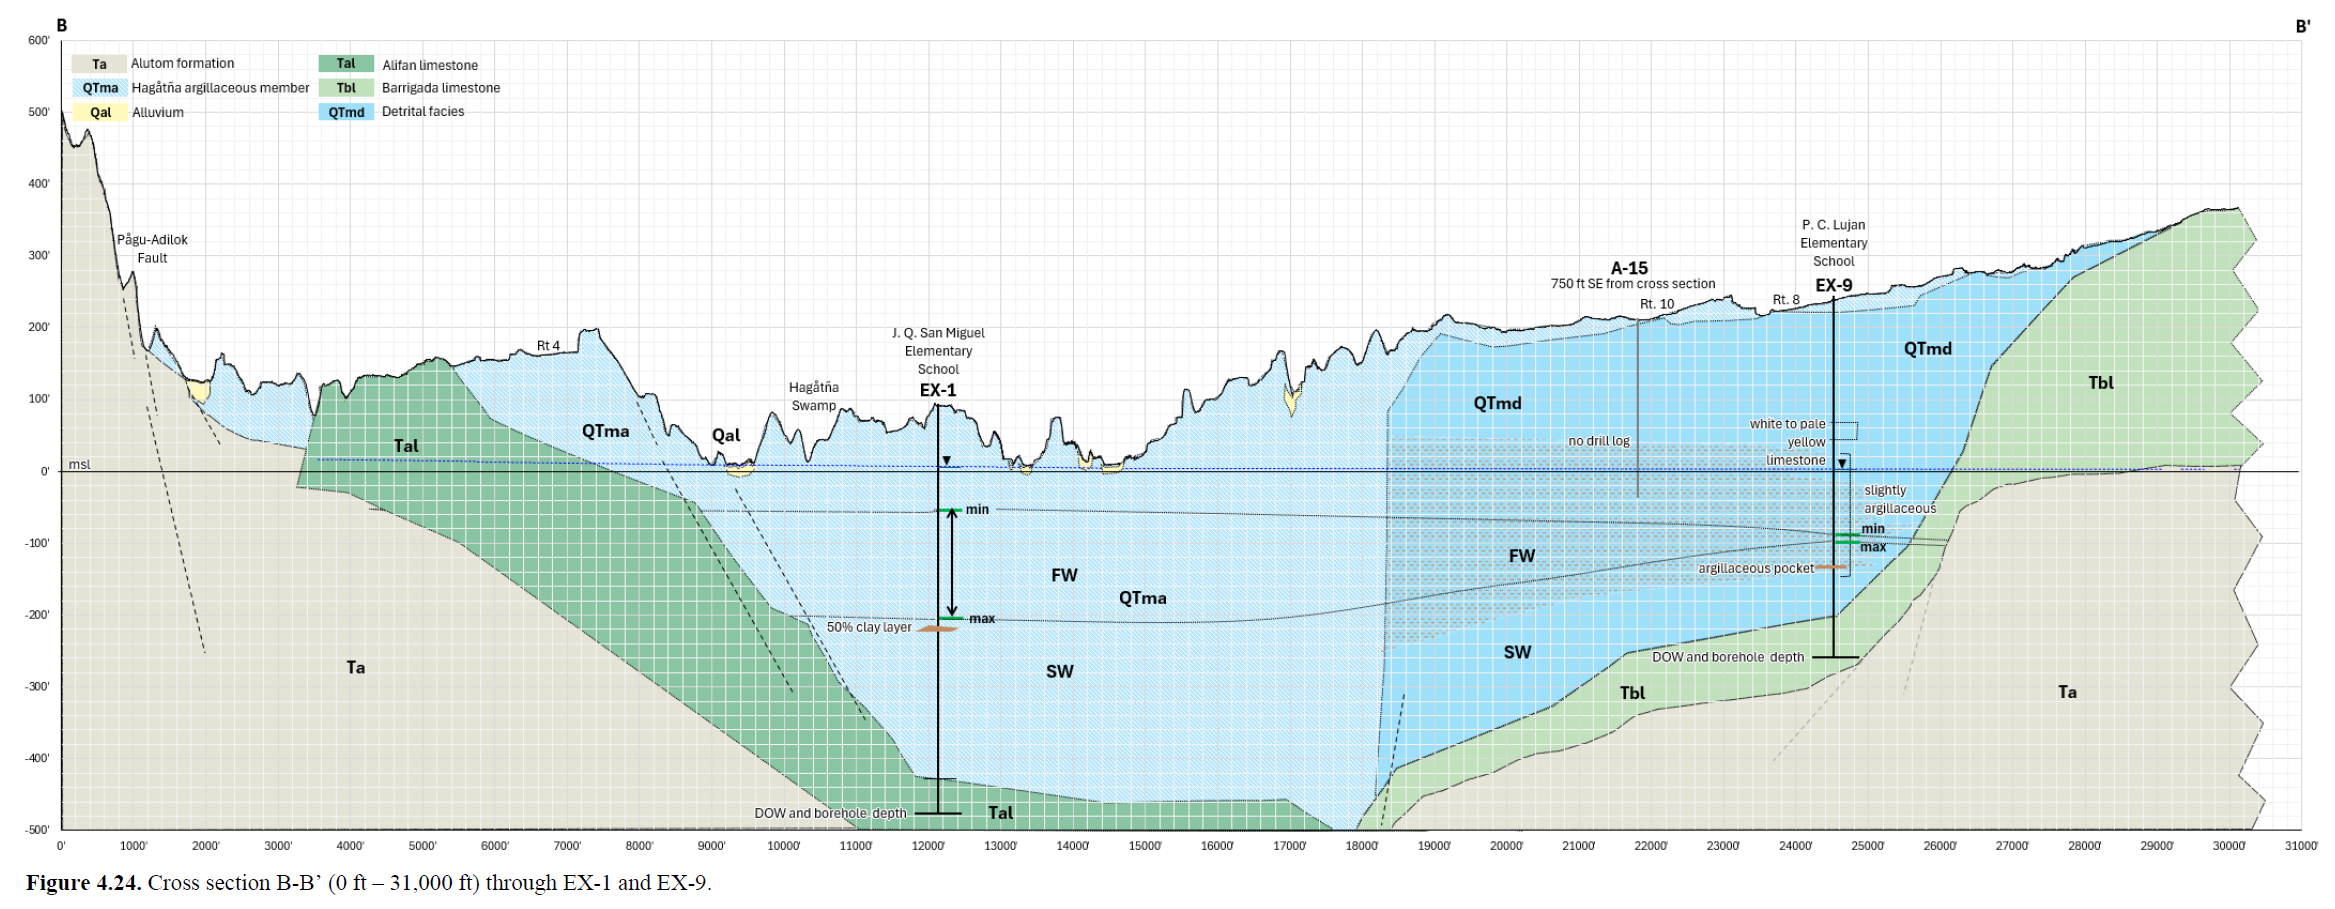
Cross section B–B′ intersects the DOWs in the Hagåtña Aquifer Basin through EX-1 and EX-9 near P.C. Lujan Elementary School. Figure 4.24 includes the Ta, Tal, QTma, Qal, QTmd, and Tbl formations and cross the Pågu-Adilok Fault, Route 4, Hagåtña Swamp, Route 10, and Route 8. GWA production well A-15 is located approximately 750 ft southeast of the cross section.
Based on the borehole log, EX-9 penetrates QTmd, described as white to pale yellow limestone that is slightly argillaceous at certain depths (Ikehara, 1982). It also intersects an argillaceous layer below the maximum BoFL depth, which may affect or inhibit the upward movement of saltwater. Surface terrain along the section is fluvial and includes alluvial deposits. In contrast, the volcanic terrain to the left of EX-1 is higher, steeper, and more rugged.
At EX-1, land surface is approximately 94 ft above msl, DOW depth is 572 ft, and the probe extends to about 478 ft below msl. Minimum and maximum BoFL depths range from about 52 to 202 ft below msl. At EX-9, land surface is approximately 239 ft above msl, DOW depth is 498 ft, and the probe extends to about 261 ft below msl.
At EX-9, a thin QTma layer underlies QTmd, with some clay present above the underlying Tbl formation, although the contact with Tbl is inferred. Surface terrain near EX-9 is also smoother and less rugged. In contrast, EX-1 is more merokarstic and contains more detrital, argillaceous, clay-rich limestone, likely derived in part from erosion of the volcanic Alutom Formation in southern Guam. Fluvial surface features are also more evident near EX-1.
Overall, the differences in lithology, clay content, and terrain between EX-1 and EX-9 help explain differences in groundwater mixing and freshwater lens response within the Hagåtña Basin. EX-9 has a more stable and thicker freshwater lens compared to EX-1, which may be explained by differences in geology and location. EX-9 is located within Barrigada Limestone and is also farther from the coast, approximately 2 mi inland. This places EX-9 in a more favorable position to receive upgradient recharge. In contrast, EX-1 is located near Hagåtña Swamp and closer to the coast, which may make it less favorable for maintaining a stable and thick freshwater lens.
Analysis of Annual Rainfall and Freshwater Lens Thickness Rate of Change
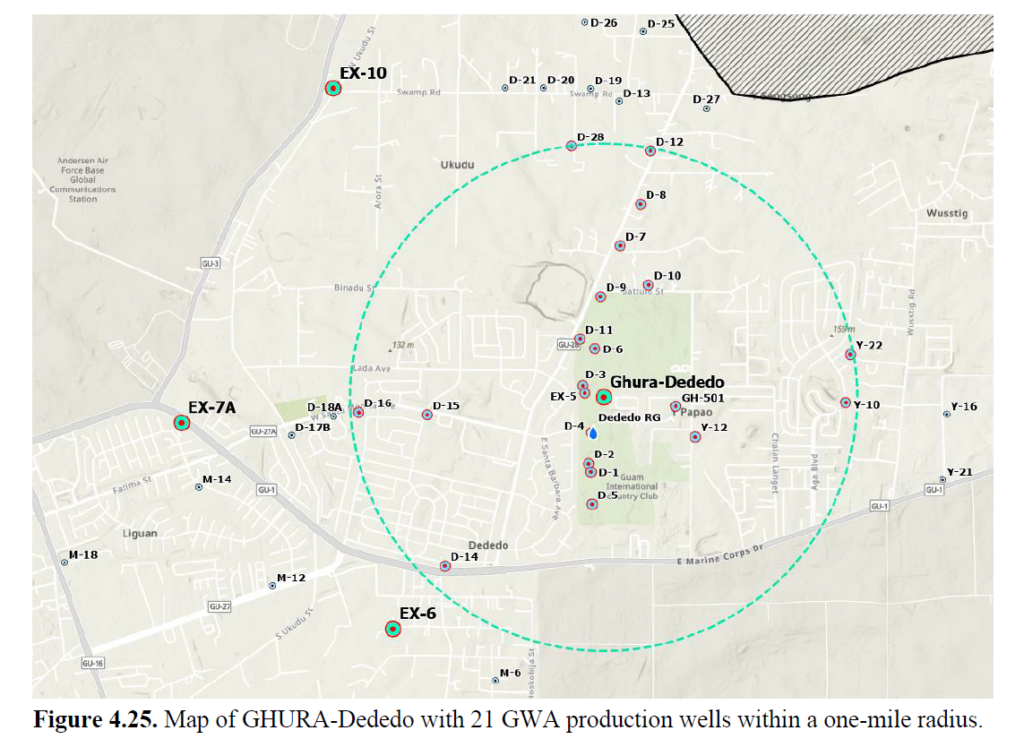
GHURA-Dededo was selected for this analysis because it is located within the basal zone of the highly productive Tomhom Basin, within one of the thickest parts of the freshwater lens, and in an area that receives upgradient recharge from suprabasal waters. In addition, 21 GWA production wells are located within a 1-mile radius and collectively produce approximately 5.3 MGD, or about 25% of the basin’s total production (Figure 4.25).
To evaluate the recharge response at GHURA-Dededo, annual rainfall was compared with the rate of freshwater lens thickness change. This comparison helps identify rainfall ranges associated with thinning, stability, and thickening of the freshwater lens (Figure 4.26). When annual rainfall was less than 90 in, the rate of change was generally negative, indicating thinning. Between about 90 and 100 in, the rate of change was near zero, indicating relative stability. Above about 100 in, the rate of change generally became positive, indicating thickening. Following annual rainfall near 140 in, the lens thickened at rates of up to 15 ft/yr.
Phreatic Transition Zone Depth Frequency
The following histograms show the frequency distribution (ƒ) of phreatic interface transition depths (ft), including water level (WL; blue), the bottom of the freshwater lens (BoFL; green), and the bottom of the transition zone (BoTZ; pink). The average BoFL and standard deviation (±2σ) are also shown. The graphs are arranged from north to south basins: Machanao, Tomhom, Hagåtña, and Pågu. Selected histograms also include the brackish pivot distribution and its average. The Guam EPA production well depth regulation of 25–40 ft below msl is also indicated (Mink, 1976).
Machanao
The phreatic interface distribution was evaluated to identify the most frequent positions of the water level, BoFL, and BoTZ through time. As shown in Figure 4.27, the most frequent water level at EX-8 was around 3.0 to 3.25 ft above msl. The BoFL occurred most frequently at approximately 111 ft below msl, while the average BoFL was deeper, at 116 ft below msl. The BoFL appears to have a multimodal and slightly asymmetric distribution rather than a normal distribution. Deeper BoFL values, around 120 to 130 ft below msl, may reflect heavy recharge events that thickened the freshwater lens and displaced the BoFL downward. The BoTZ occurred most frequently near 158 ft below msl and also appears to have a multimodal distribution. Deeper BoTZ values, around 180 ft below msl, may correspond to periods of lens thickening.
Tomhom
The phreatic interface distributions for the Tomhom Basin DOWs were evaluated to compare the most frequent positions of the BoFL, BoTZ, and brackish pivot where applicable. These distributions help show how lens thickness and transition-zone depth varied among EX-10, GHURA-Dededo, EX-7, EX-7A, and EX-6. As shown in Figures 4.28 and 4.29, each DOW exhibits different patterns of interface variability. At EX-10, the BoFL appears multimodal, with most occurrences between 92 and 108 ft below msl and an average depth of 99.3 below msl. The relatively narrow range suggests limited variation in freshwater lens thickness compared to the other Tomhom DOWs. Shallower than average BoFL depths may correspond to reduced recharge, whereas deeper BoFL depths may reflect increased recharge. The BoTZ distribution is also multimodal, with a main peak near 135 ft below msl and smaller peaks near 140 ft below msl, which may reflect periods of lens thinning and thickening.
GHURA-Dededo’s BoFL is also multimodal and shows the greatest overall spread among the Tomhom DOWs. Most BoFL occurrences cluster between ~110 and 125 ft below msl, with an average depth of 119 ft below msl, although one shallow occurrence near 33 ft below msl expanding the total range. The BoTZ distribution is likewise multimodal, with the strongest peak ~140 ft below msl and additional peaks 150-155 ft and 180 ft below msl. The shallower BoTZ depth may correspond to lens thinning, while the deeper peaks may reflect lens thickening.
EX-7 also shows a multimodal BoFL distribution, ranging from 90 to 120 ft below msl. The most frequent BoFL depth is ~95 ft below msl, with additional peaks near 105 ft -115 ft below msl; the average depth is ~106 ft below msl. Shallower BoFL depths may correspond to drier conditions or reduced recharge, whereas deeper depths may reflect heavier recharge. The BoTZ distribution is also multimodal, extending from about 145 to 245 ft below msl, and likely reflects periods of lens thinning and thickening.
At EX-7A, the brackish pivot was also plotted because groundwater was already brackish at the start of probe recording. The brackish pivot distribution appears unimodal, with both the mode and average near 105 ft below msl. This may indicate that the top of the brackish lens fluctuates less than the freshwater lens under varying hydrologic conditions. In contrast, the BoTZ distribution appears multimodal, ranging from 160 to 176 ft below msl.
The BoFL distribution at EX-6 appears bimodal, ranging from 124-136 feet below msl, with peaks near 124 ft and 136 ft below msl. The shallower peak may correspond to reduced recharge, whereas the deeper peak may reflect greater recharge and lens thickening. Overall, the narrow range suggests relatively limited fluctuation in lens thickness. No BoTZ distribution is shown because the probe record did not capture the bottom of the transition zone.
Among these wells, GHURA-Dededo exhibits the deepest mean BoFL and the largest spread in BoFL depth because of the shallow depth at 33 ft below msl. In contrast, EX-10 and EX-7 show shallower BoFL positions overall. EX-7 also has the deepest and most variable BoTZ among the Tomhom DOWs.
Hagåtña and Pågu
The phreatic interface distributions for EX-9, EX-1, and EX-4 were evaluated to compare freshwater lens and transition-zone behavior in the Hagåtña and Pågu Basins. These distributions help show how stable or variable each interface was through time, especially in DOWs with more complex brackish mixing. Figure 4.30 shows the phreatic interface frequency distributions for EX-9, EX-1, and EX-4. The BoFL distribution at EX-9 appears multimodal, ranging from about 82 to 106 ft below msl, with an average depth of about 92 ft below msl. The most frequent BoFL depths occur near 88 to 90 ft below msl. Shallower BoFL depths may correspond to periods of reduced recharge or drought, whereas deeper BoFL depths may reflect periods of greater recharge. The BoTZ appears broadly unimodal, with most occurrences clustered between ~165 and 175 ft below msl. This may indicate that the transition zone is less variable than the freshwater lens under changing recharge conditions.
EX-1 BoFL distribution appears multimodal and exhibits a broad spread, ranging from about 40 to 210 ft below msl. The dominant peak occurs between about 50 and 60 ft below msl, representing the shallowest and most frequent BoFL depths, while the mean BoFL is about 90.7 ft below msl. The brackish pivot also appears multimodal, with the most frequent depths near 170 to 180 ft below msl. The BoTZ distribution is likewise multimodal and broad, extending from about 270 to 490 ft below msl. Its strongest peak occurs near 470 to 480 ft below msl, indicating that the deepest BoTZ positions are also the most frequently observed.
BoFL distribution at EX-4 is broad, ranging from about 10 ft above msl to 240 ft below msl, indicating substantial variation in freshwater lens thickness. The dominant BoFL peak occurs from near msl to about 10 ft below msl, indicating an extremely shallow freshwater lens. At many times, the GEPA production well depth zone of 25 to 40 ft below msl appears to extend below the BoFL, suggesting that production at this depth may intersect brackish water. This may help explain elevated chloride concentrations in nearby production wells (Figure 4.15). The shallowest BoFL depths nearly coincide with water level, indicating that the freshwater layer may at times be very thin. The brackish pivot distribution is also multimodal and spans a wide range, from about 110 to 250 ft below msl.
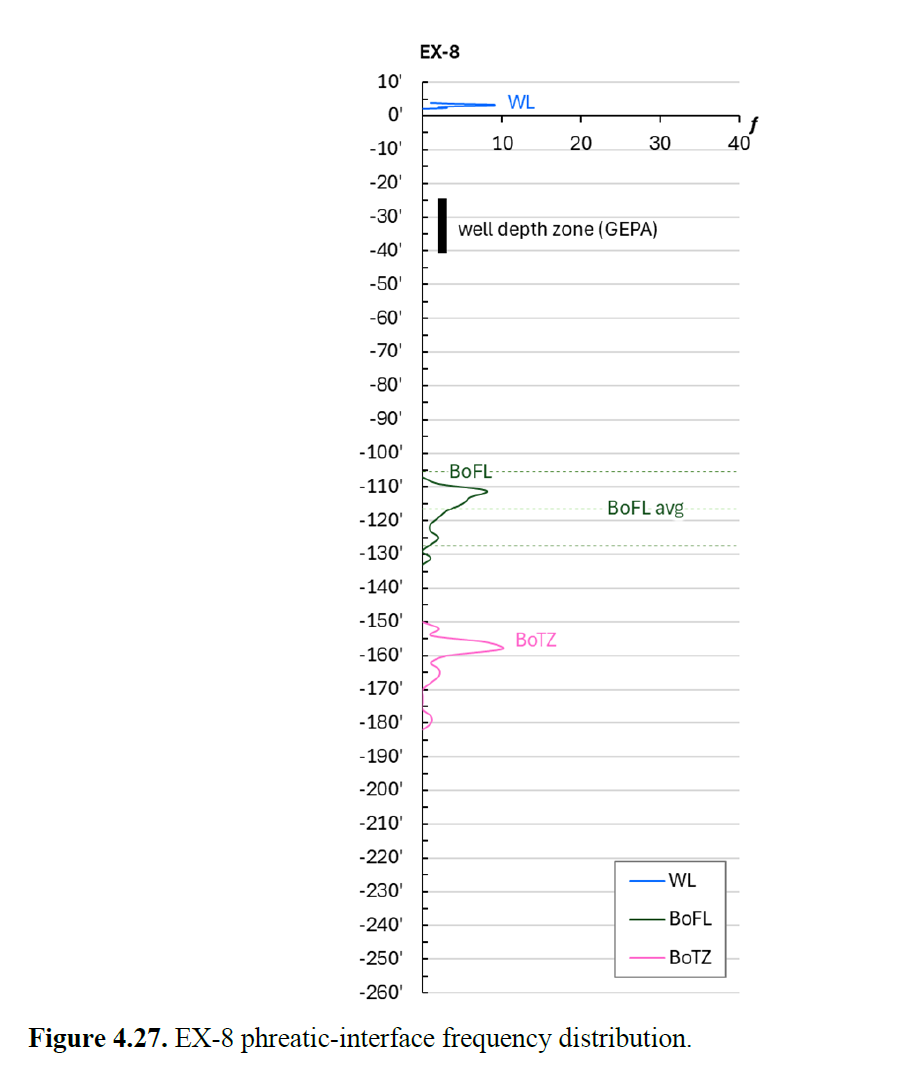
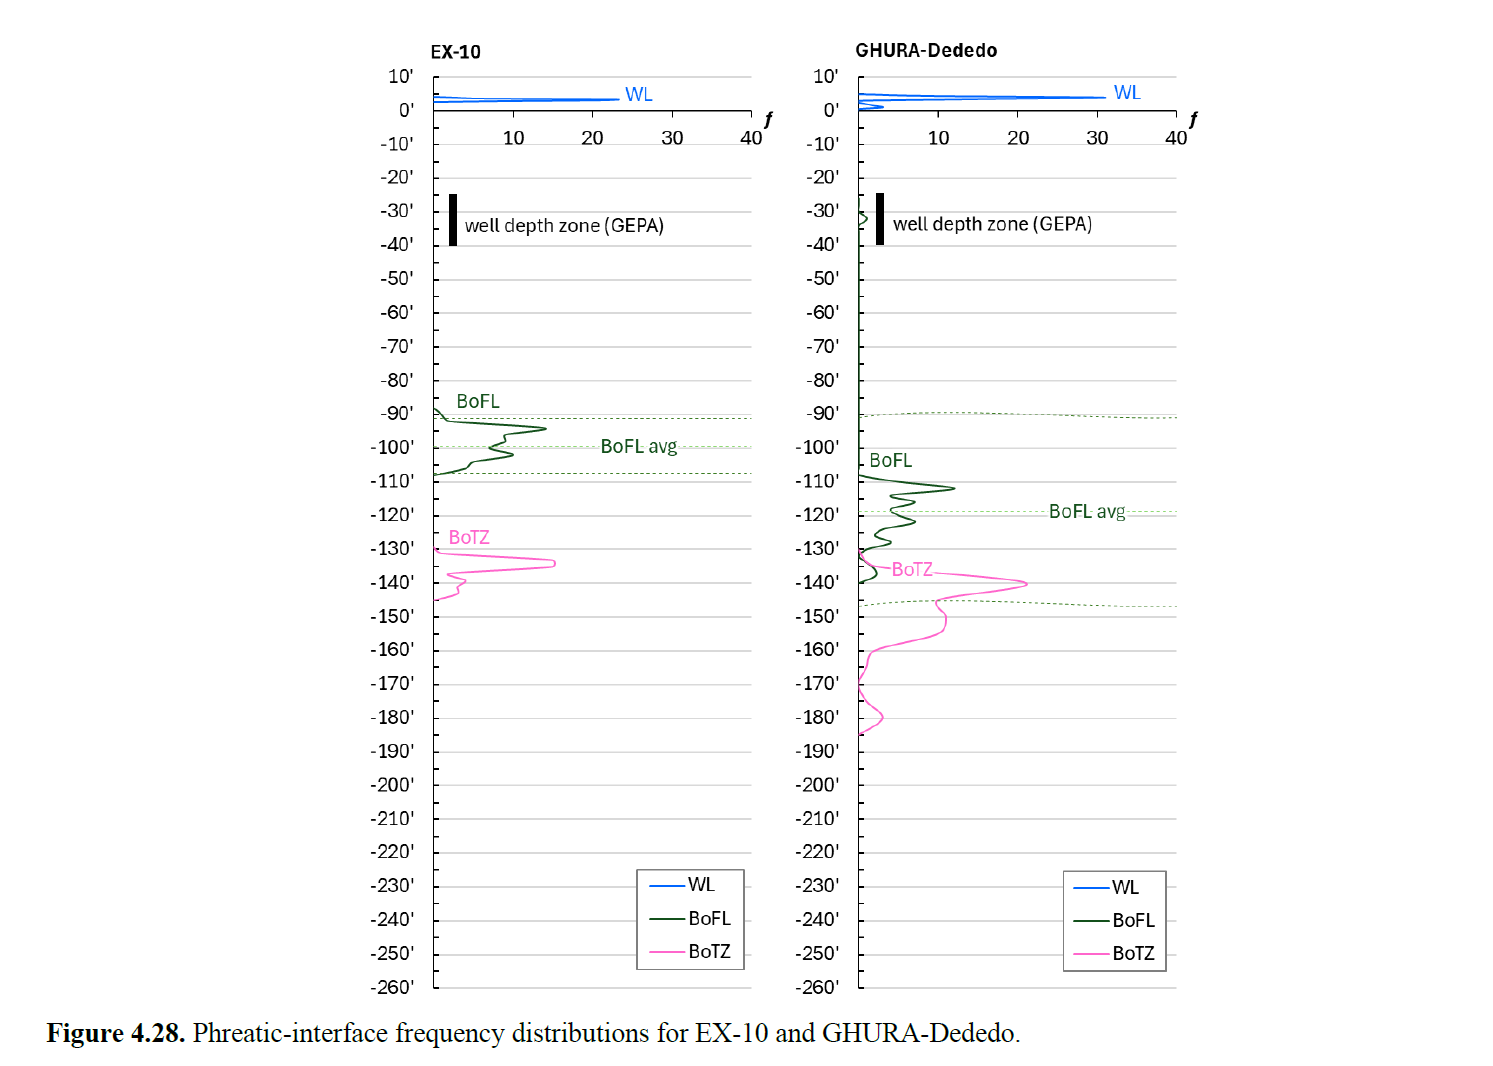
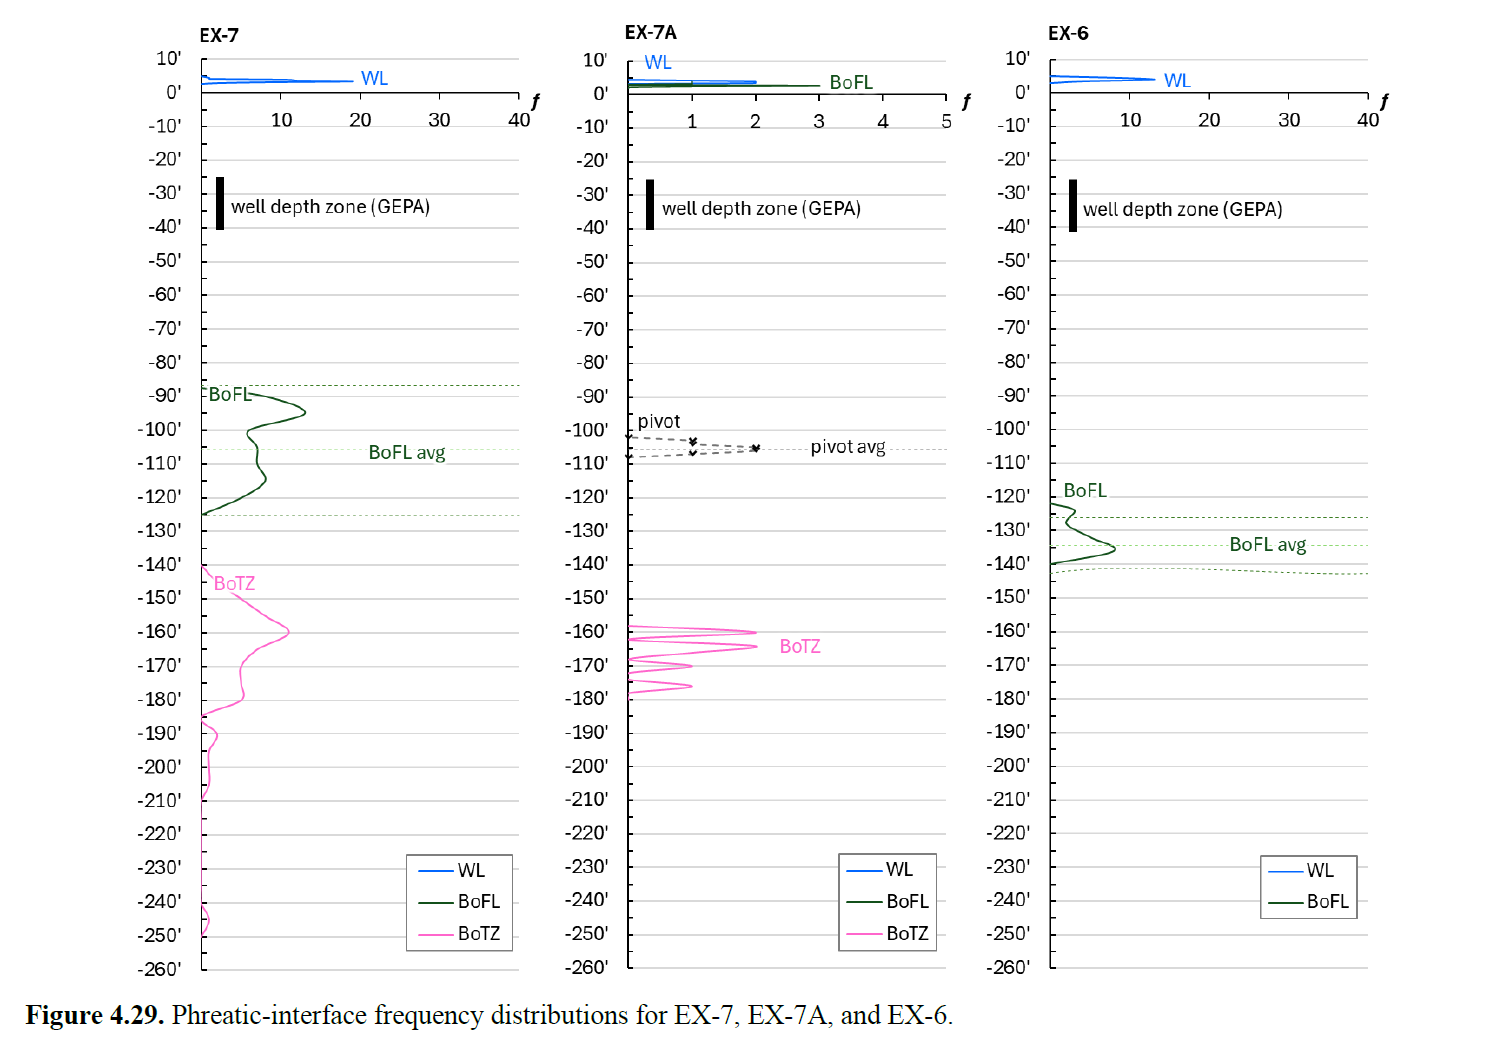
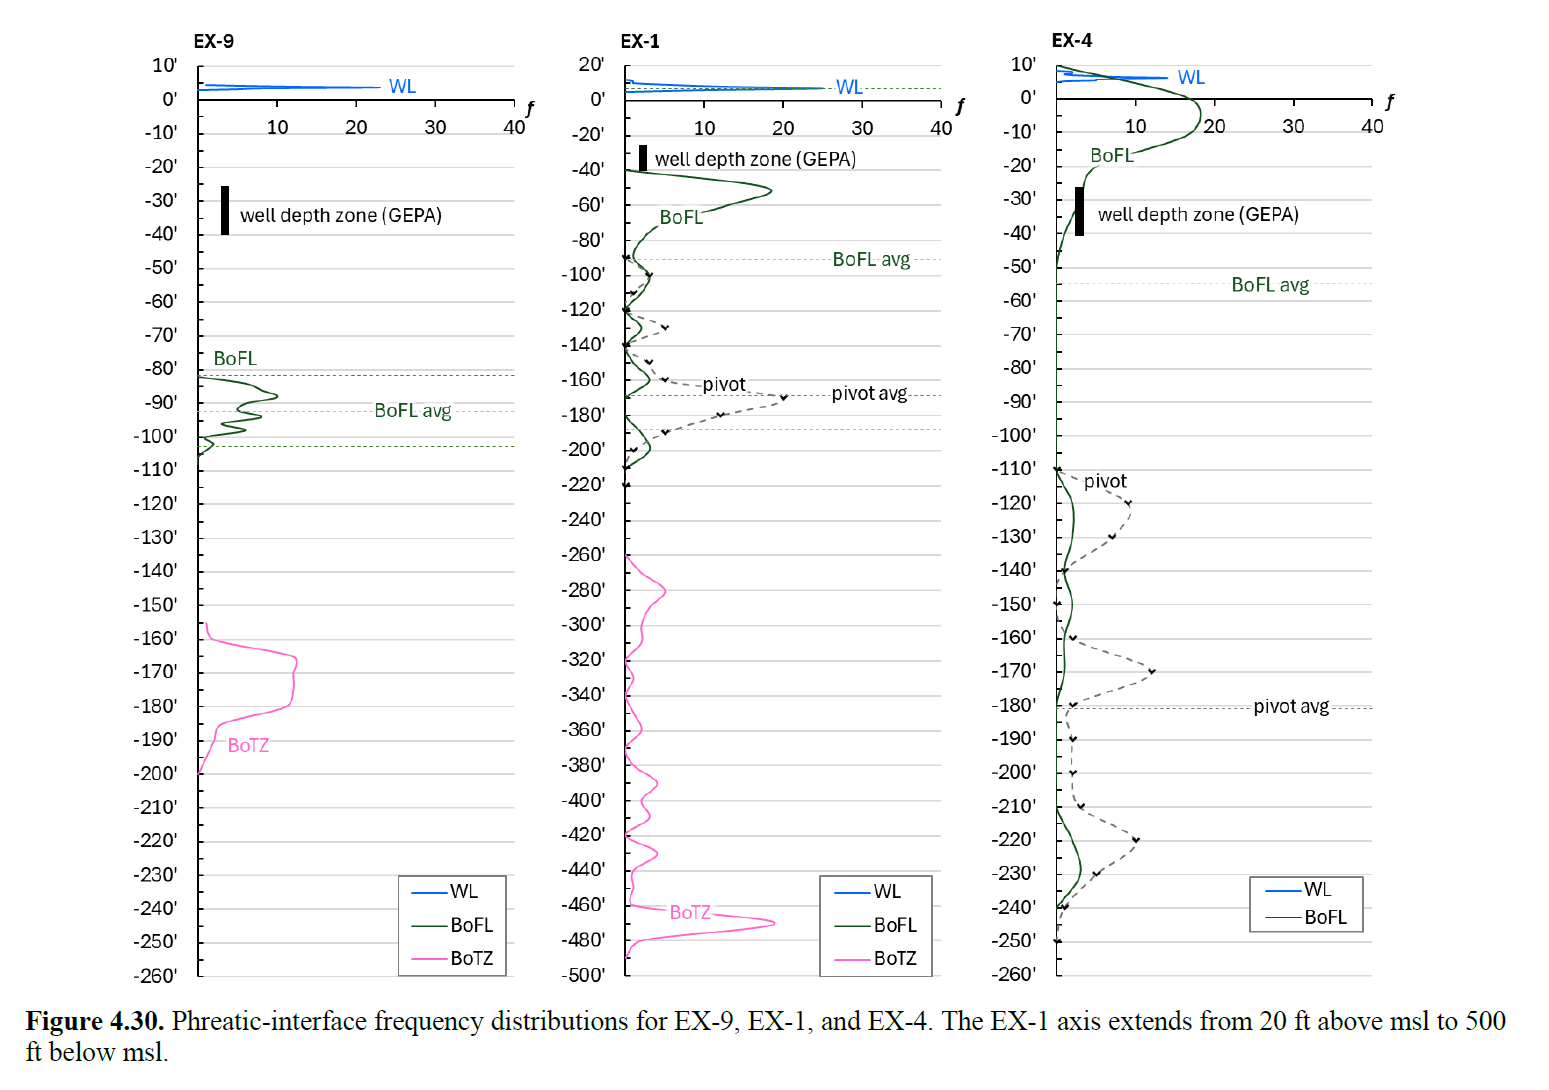
Conclusion and Recommendations
The conclusions and recommendations are based on the analysis of DOW phreatic hydrographs from 2000 to 2024. Freshwater lens response is compared among the Machanao, Tomhom, Hagåtña, and Pågu aquifer basins, followed by recommendations for continued DOW observation, groundwater management, and future studies of the NGLA.
Accomplished Objectives
The objectives of this study were accomplished by compiling CTD, rainfall, tide, and climate data from 2000 to 2024 to develop and analyze phreatic hydrographs for each DOW. These analyses were used to evaluate freshwater lens thickness response to climatic and hydrologic factors across four aquifer basins. Geologic cross sections and phreatic transition zone depth frequency analyses further supported interpretation of hydrologic variability among the DOWs. Recommendations based on the results of this study are presented in this chapter.
Summary Conclusion
DOW location, porosity, hydraulic conductivity, and local geology influenced freshwater lens thickness and response to recharge and drought across the NGLA. DOWs within the Barrigada Limestone generally showed thicker freshwater lenses and a stronger thickening response when annual rainfall was greater than 100 in, while the Hagåtña Argillaceous DOWs showed thinner, flashier, and more complex responses. Although semiannual CTD data collection limited the ability to capture short-term responses, the data still provided useful insight into how each DOW responded to rainfall variability and drought.
Recommendations
Installation of additional DOWs are recommended in the Hagåtña and Pågu Basins, where complex subsurface geology, thicker transition zones, and more variable freshwater and brackish lenses were observed. Additional rain gages should also be installed in these basins to improve the spatial representation of rainfall across the aquifer. Where possible, data collection frequency should be increased to improve the temporal resolution of freshwater lens response to recharge and drought.
Areas within the Hagåtña and Pågu Basins may be less favorable for future production well development because this area appears to be more susceptible to saltwater intrusion, with thin freshwater lenses overlying thick brackish lenses. The conductivity–temperature experiment used to estimate the conductivity equivalent of 250 mg/L chloride should also be replicated and refined using more trials and additional solutions near the target chloride concentration.
Recommended Use
These results may support interagency groundwater management by agencies such as Guam Waterworks Authority (GWA) by helping identify areas more favorable for production well development and areas where pumping may require more careful management. In addition, the findings may support groundwater modeling by providing baseline information on freshwater lens thickness for model development and calibration.
Findings for Further Study
Further study is recommended to examine the relationship between freshwater lens thickness, water production, and chloride concentration to better understand how pumping influences freshwater lens response and water quality over time. Additional research is needed to better understand upward saltwater diffusion within the DOWs. Further investigation of transition zone behavior, transition zone thickness, and brackish pivot depth may improve understanding of freshwater and brackish lenses, groundwater mixing, and lens variability.